Solution - Forecasting with Linear Factor Pricing Models#
# Output from previous execution
Loaded 25 size/value portfolios (FF 25)
Date range: 1980-01-31 to 2025-08-31
Number of monthly observations: 548
# Output from previous execution
Built forecasts using expanding factor premia
Factor model: ['MKT', 'HML', 'RMW', 'UMD']
Rolling window: 60 months (5.0 years)
# Output from previous execution
| OOS R-squared | IC | |
|---|---|---|
| Mean | -0.4% | -5.9% |
| Median | -0.4% | -5.3% |
| Min | -1.1% | -11.7% |
| Max | 0.2% | 0.2% |
| % Positive | 16.0% | 4.0% |
# Output from previous execution
| OOS R-squared | IC | |
|---|---|---|
| ME5 BM4 | -0.0% | 0.2% |
| BIG LoBM | 0.2% | -0.8% |
| SMALL LoBM | 0.1% | -1.0% |
| ME4 BM5 | 0.2% | -2.7% |
| ME3 BM5 | -0.0% | -3.3% |
| OOS R-squared | IC | |
|---|---|---|
| ME4 BM3 | -0.5% | -11.7% |
| ME4 BM1 | -0.6% | -11.7% |
| ME5 BM2 | 0.0% | -11.4% |
| ME4 BM2 | -0.4% | -9.5% |
| ME3 BM3 | -0.3% | -9.2% |
# Output from previous execution
CAPM / expanding...
CAPM / constant...
AQR 4-Factor / expanding...
AQR 4-Factor / constant...
FF 5-Factor / expanding...
FF 5-Factor / constant...
| Mean OOS R-squared | Mean IC | ||
|---|---|---|---|
| Factor Model | Lambda Method | ||
| CAPM | expanding | -0.0% | -7.3% |
| constant | 0.3% | 0.2% | |
| AQR 4-Factor | expanding | -0.4% | -5.9% |
| constant | 0.1% | -0.1% | |
| FF 5-Factor | expanding | -0.1% | -7.5% |
| constant | 0.3% | -0.7% |
# Output from previous execution
CAPM / 36 months...
CAPM / 48 months...
CAPM / 60 months...
CAPM / 120 months...
CAPM / 180 months...
CAPM / 240 months...
AQR 4-Factor / 36 months...
AQR 4-Factor / 48 months...
AQR 4-Factor / 60 months...
AQR 4-Factor / 120 months...
AQR 4-Factor / 180 months...
AQR 4-Factor / 240 months...
| Mean OOS R-squared | Mean IC | ||
|---|---|---|---|
| Factor Model | Beta Window (months) | ||
| CAPM | 36 | 0.4% | 1.8% |
| 48 | 0.4% | 1.0% | |
| 60 | 0.3% | 0.2% | |
| 120 | 0.3% | 2.7% | |
| 180 | 0.2% | 1.4% | |
| 240 | 0.2% | 1.9% | |
| AQR 4-Factor | 36 | 0.2% | 1.4% |
| 48 | 0.1% | -0.8% | |
| 60 | 0.1% | -0.1% | |
| 120 | 0.2% | 1.3% | |
| 180 | 0.1% | 0.3% | |
| 240 | 0.2% | 1.4% |
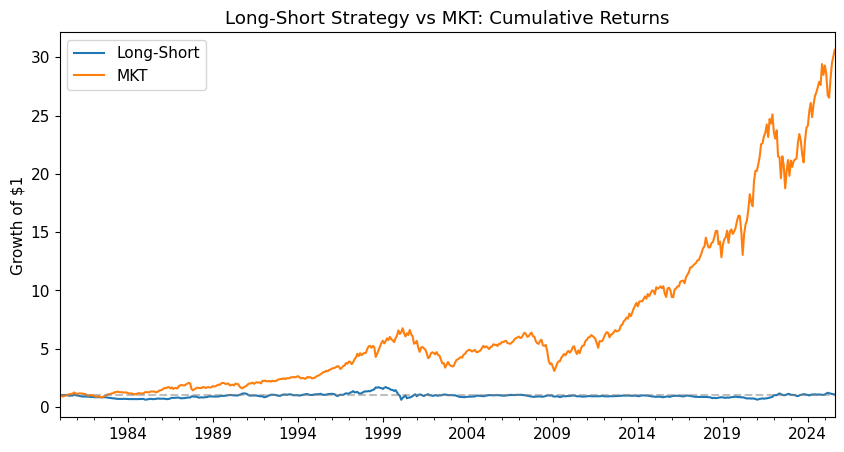
# Output from previous execution
| Mean | Vol | Sharpe | |
|---|---|---|---|
| Long-Short | 1.3% | 14.4% | 8.7% |
| MKT | 8.8% | 15.6% | 56.1% |
# Output from previous execution
| alpha | MKT | r-squared | Info Ratio | |
|---|---|---|---|---|
| Long-Short | 2.85% | -18.27% | 3.94% | 20.22% |
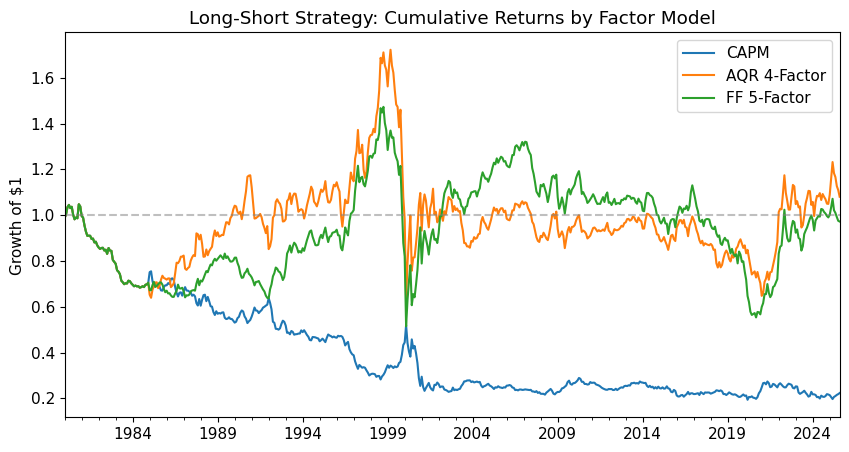
# Output from previous execution
# Output from previous execution
| Mean OOS R-squared | Mean IC | |
|---|---|---|
| CAPM | -0.0% | -7.3% |
| AQR 4-Factor | -0.4% | -5.9% |
| FF 5-Factor | -0.1% | -7.5% |
| Mean | Vol | Sharpe | |
|---|---|---|---|
| CAPM | -2.6% | 12.0% | -21.5% |
| AQR 4-Factor | 1.3% | 14.4% | 8.7% |
| FF 5-Factor | 0.9% | 13.4% | 6.7% |
| alpha | MKT | r-squared | Info Ratio | |
|---|---|---|---|---|
| CAPM | -5.17% | 29.69% | 15.04% | -46.88% |
| AQR 4-Factor | 2.85% | -18.27% | 3.94% | 20.22% |
| FF 5-Factor | 2.39% | -17.08% | 3.94% | 18.15% |
# Output from previous execution