Statistics of the DFA Factors#
# Output from previous execution
/var/folders/zx/3v_qt0957xzg3nqtnkv007d00000gn/T/ipykernel_92294/4220933265.py:2: FutureWarning: 'M' is deprecated and will be removed in a future version, please use 'ME' instead.
  dts['early'] = pd.date_range(start=facs.index[0], end='31/12/1980',freq='M')
/var/folders/zx/3v_qt0957xzg3nqtnkv007d00000gn/T/ipykernel_92294/4220933265.py:3: FutureWarning: 'M' is deprecated and will be removed in a future version, please use 'ME' instead.
  dts['founding'] = pd.date_range(start='1/1/1981', end='31/12/2001',freq='M')
/var/folders/zx/3v_qt0957xzg3nqtnkv007d00000gn/T/ipykernel_92294/4220933265.py:4: FutureWarning: 'M' is deprecated and will be removed in a future version, please use 'ME' instead.
  dts['recent'] = pd.date_range(start='1/1/2002', end=facs.index[-1],freq='M')
/var/folders/zx/3v_qt0957xzg3nqtnkv007d00000gn/T/ipykernel_92294/4220933265.py:6: FutureWarning: 'M' is deprecated and will be removed in a future version, please use 'ME' instead.
  dts['1990s'] = pd.date_range(start='1/1/1991', end='31/12/1999',freq='M')
# Output from previous execution
========================================================
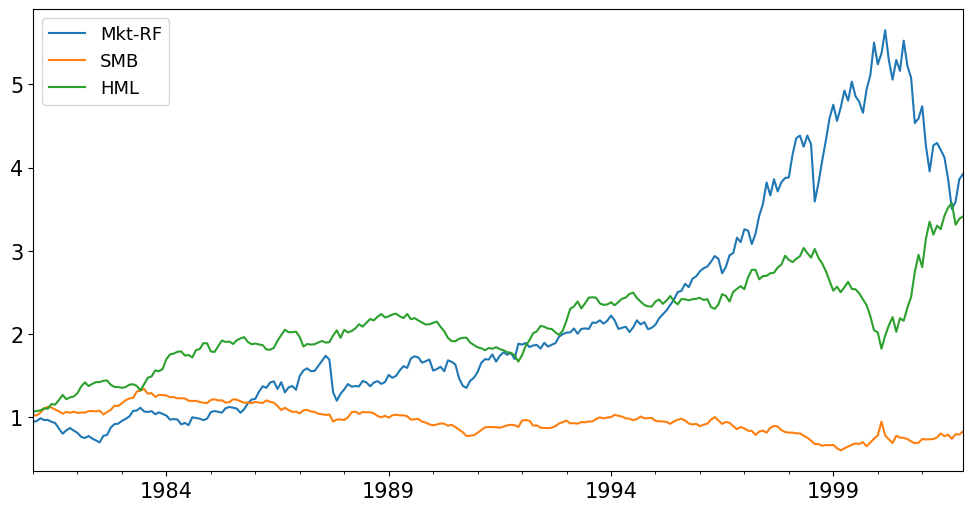
Period: 1926-07-31 00:00:00 to 1980-12-31 00:00:00
========================================================
| Mean | Vol | Sharpe | Min | Max | VaR (0.05) | |
|---|---|---|---|---|---|---|
| Mkt-RF | 0.0810 | 0.2050 | 0.3949 | -0.2874 | 0.3881 | -0.0841 |
| SMB | 0.0339 | 0.1143 | 0.2968 | -0.0989 | 0.3596 | -0.0419 |
| HML | 0.0503 | 0.1342 | 0.3749 | -0.1319 | 0.3552 | -0.0442 |
========================================================

Period: 1981-01-31 00:00:00 to 2001-12-31 00:00:00

========================================================
| Mean | Vol | Sharpe | Min | Max | VaR (0.05) | |
|---|---|---|---|---|---|---|
| Mkt-RF | 0.0779 | 0.1572 | 0.4953 | -0.2319 | 0.1245 | -0.0641 |
| SMB | -0.0020 | 0.1173 | -0.0172 | -0.1741 | 0.2125 | -0.0459 |
| HML | 0.0646 | 0.1099 | 0.5876 | -0.0977 | 0.1224 | -0.0416 |
========================================================
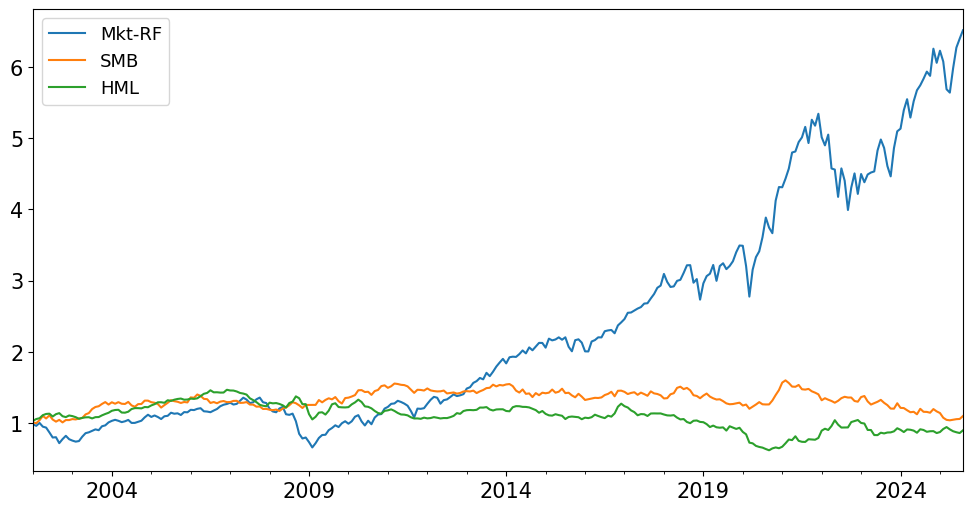
Period: 2002-01-31 00:00:00 to 2025-08-31 00:00:00
========================================================
| Mean | Vol | Sharpe | Min | Max | VaR (0.05) | |
|---|---|---|---|---|---|---|
| Mkt-RF | 0.0913 | 0.1535 | 0.5947 | -0.1720 | 0.1360 | -0.0773 |
| SMB | 0.0079 | 0.0884 | 0.0897 | -0.0593 | 0.0714 | -0.0392 |
| HML | 0.0012 | 0.1064 | 0.0113 | -0.1383 | 0.1286 | -0.0415 |
========================================================

Period: 1991-01-31 00:00:00 to 1999-12-31 00:00:00

========================================================
| Mean | Vol | Sharpe | Min | Max | VaR (0.05) | |
|---|---|---|---|---|---|---|
| Mkt-RF | 0.1556 | 0.1298 | 1.1988 | -0.1605 | 0.1085 | -0.0416 |
| SMB | -0.0007 | 0.1042 | -0.0070 | -0.0694 | 0.0848 | -0.0501 |
| HML | 0.0142 | 0.0922 | 0.1539 | -0.0766 | 0.0651 | -0.0406 |
========================================================

Period: 1981-01-31 00:00:00 to 2025-08-31 00:00:00

========================================================
| Mean | Vol | Sharpe | Min | Max | VaR (0.05) | |
|---|---|---|---|---|---|---|
| Mkt-RF | 0.0850 | 0.1551 | 0.5478 | -0.2319 | 0.1360 | -0.0723 |
| SMB | 0.0033 | 0.1029 | 0.0316 | -0.1741 | 0.2125 | -0.0418 |
| HML | 0.0310 | 0.1083 | 0.2860 | -0.1383 | 0.1286 | -0.0415 |
========================================================

Period: 1926-07-31 00:00:00 to 2025-08-31 00:00:00

========================================================
| Mean | Vol | Sharpe | Min | Max | VaR (0.05) | |
|---|---|---|---|---|---|---|
| Mkt-RF | 0.0828 | 0.1841 | 0.4495 | -0.2874 | 0.3881 | -0.0792 |
| SMB | 0.0201 | 0.1093 | 0.1839 | -0.1741 | 0.3596 | -0.0418 |
| HML | 0.0416 | 0.1232 | 0.3377 | -0.1383 | 0.3552 | -0.0424 |
# Output from previous execution
(<Figure size 400x400 with 2 Axes>,
 <Axes: title={'center': 'Correlation matrix (lower triangle)'}>)
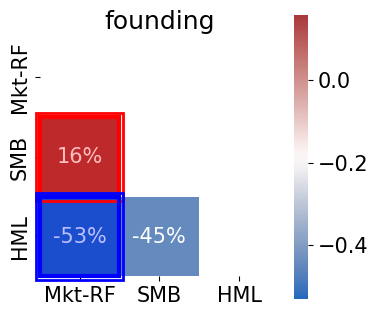
Text(0.5, 1.0, 'founding')
(<Figure size 400x400 with 2 Axes>,
 <Axes: title={'center': 'Correlation matrix (lower triangle)'}>)
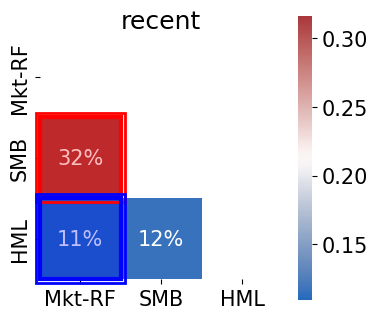
Text(0.5, 1.0, 'recent')
(<Figure size 400x400 with 2 Axes>,
 <Axes: title={'center': 'Correlation matrix (lower triangle)'}>)
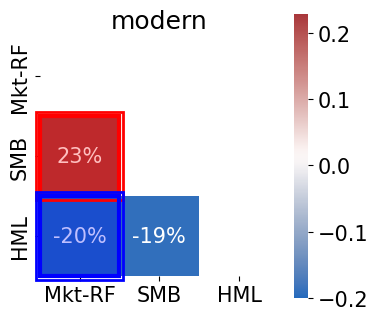
Text(0.5, 1.0, 'modern')
(<Figure size 400x400 with 2 Axes>,
 <Axes: title={'center': 'Correlation matrix (lower triangle)'}>)
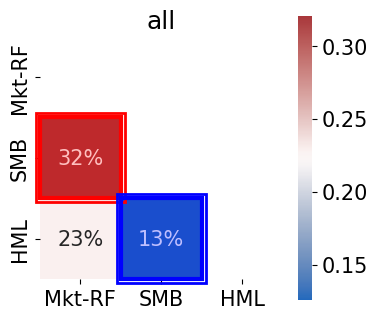
Text(0.5, 1.0, 'all')
# Output from previous execution
<Axes: >
<Axes: >
# Output from previous execution
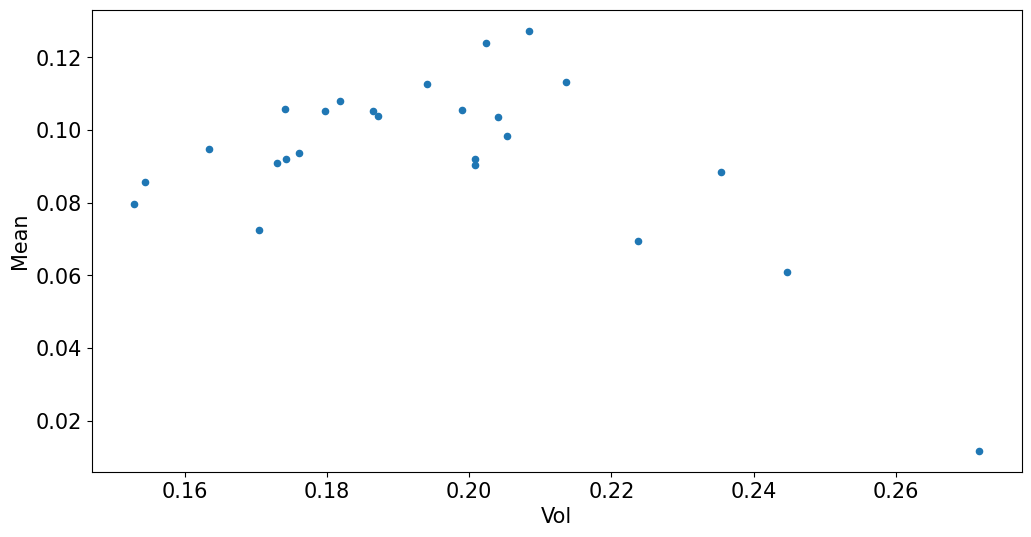
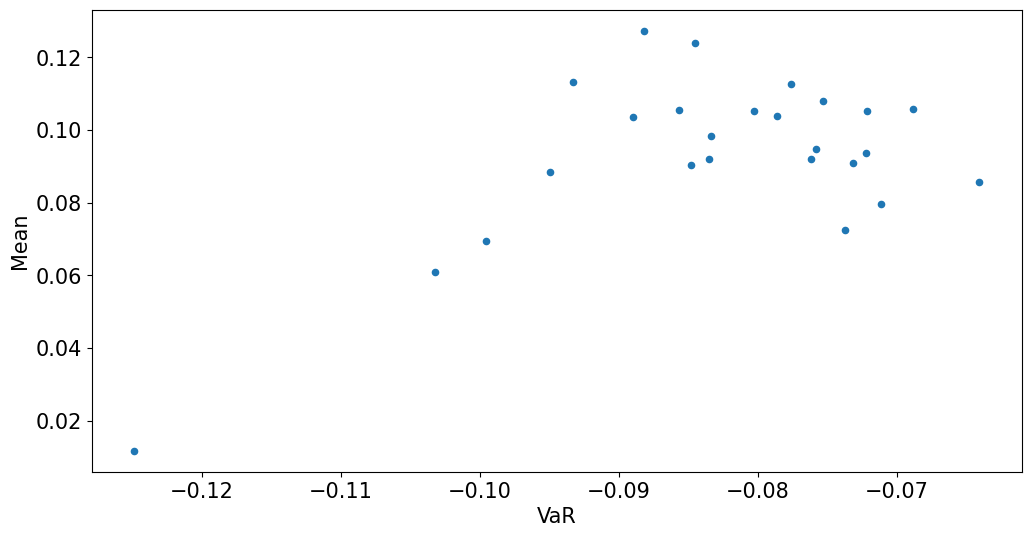
| Mean | Vol | Sharpe | Min | Max | VaR (0.05) | |
|---|---|---|---|---|---|---|
| SMALL LoBM | 0.0117 | 0.2717 | 0.0431 | -0.3477 | 0.3596 | -0.1249 |
| ME1 BM2 | 0.0884 | 0.2354 | 0.3756 | -0.3128 | 0.4309 | -0.0949 |
| ME1 BM3 | 0.0902 | 0.2008 | 0.4493 | -0.2919 | 0.1999 | -0.0848 |
| ME1 BM4 | 0.1125 | 0.1940 | 0.5800 | -0.2896 | 0.2563 | -0.0776 |
| SMALL HiBM | 0.1273 | 0.2084 | 0.6110 | -0.2908 | 0.4121 | -0.0882 |
| ME2 BM1 | 0.0609 | 0.2447 | 0.2490 | -0.3308 | 0.3024 | -0.1032 |
| ME2 BM2 | 0.0984 | 0.2054 | 0.4790 | -0.3254 | 0.1892 | -0.0834 |
| ME2 BM3 | 0.1052 | 0.1864 | 0.5640 | -0.2926 | 0.1832 | -0.0803 |
| ME2 BM4 | 0.1081 | 0.1819 | 0.5942 | -0.2526 | 0.1869 | -0.0753 |
| ME2 BM5 | 0.1132 | 0.2137 | 0.5298 | -0.3209 | 0.2596 | -0.0933 |
| ME3 BM1 | 0.0694 | 0.2237 | 0.3103 | -0.3030 | 0.2217 | -0.0995 |
| ME3 BM2 | 0.1040 | 0.1871 | 0.5555 | -0.2908 | 0.1874 | -0.0786 |
| ME3 BM3 | 0.0910 | 0.1729 | 0.5264 | -0.2551 | 0.1669 | -0.0732 |
| ME3 BM4 | 0.1053 | 0.1797 | 0.5863 | -0.2667 | 0.1666 | -0.0722 |
| ME3 BM5 | 0.1240 | 0.2024 | 0.6125 | -0.3131 | 0.2291 | -0.0845 |
| ME4 BM1 | 0.0919 | 0.2008 | 0.4575 | -0.2615 | 0.2538 | -0.0835 |
| ME4 BM2 | 0.0937 | 0.1761 | 0.5323 | -0.2929 | 0.1553 | -0.0723 |
| ME4 BM3 | 0.0920 | 0.1742 | 0.5282 | -0.2514 | 0.1681 | -0.0762 |
| ME4 BM4 | 0.1059 | 0.1741 | 0.6081 | -0.3220 | 0.1627 | -0.0688 |
| ME4 BM5 | 0.1056 | 0.1990 | 0.5307 | -0.3264 | 0.2037 | -0.0857 |
| BIG LoBM | 0.0949 | 0.1634 | 0.5807 | -0.2225 | 0.1490 | -0.0758 |
| ME5 BM2 | 0.0857 | 0.1544 | 0.5552 | -0.2305 | 0.1607 | -0.0641 |
| ME5 BM3 | 0.0796 | 0.1529 | 0.5211 | -0.2263 | 0.1425 | -0.0711 |
| ME5 BM4 | 0.0726 | 0.1704 | 0.4258 | -0.2759 | 0.1636 | -0.0738 |
| BIG HiBM | 0.1035 | 0.2040 | 0.5076 | -0.2858 | 0.2199 | -0.0890 |
# Output from previous execution
# Output from previous execution
| alpha | Mkt-RF | r-squared | Treynor Ratio | Info Ratio | |
|---|---|---|---|---|---|
| SMALL LoBM | -0.1037 | 1.3585 | 0.6014 | 0.0086 | -0.6047 |
| ME1 BM2 | -0.0106 | 1.1658 | 0.5900 | 0.0759 | -0.0705 |
| ME1 BM3 | 0.0010 | 1.0495 | 0.6571 | 0.0860 | 0.0088 |
| ME1 BM4 | 0.0295 | 0.9773 | 0.6105 | 0.1151 | 0.2435 |
| SMALL HiBM | 0.0429 | 0.9939 | 0.5476 | 0.1281 | 0.3058 |
| ME2 BM1 | -0.0524 | 1.3341 | 0.7154 | 0.0457 | -0.4018 |
| ME2 BM2 | 0.0016 | 1.1390 | 0.7401 | 0.0864 | 0.0151 |
| ME2 BM3 | 0.0171 | 1.0357 | 0.7426 | 0.1015 | 0.1812 |
| ME2 BM4 | 0.0251 | 0.9765 | 0.6937 | 0.1107 | 0.2493 |
| ME2 BM5 | 0.0188 | 1.1108 | 0.6505 | 0.1019 | 0.1488 |
| ME3 BM1 | -0.0383 | 1.2677 | 0.7725 | 0.0548 | -0.3589 |
| ME3 BM2 | 0.0112 | 1.0911 | 0.8179 | 0.0953 | 0.1408 |
| ME3 BM3 | 0.0069 | 0.9895 | 0.7879 | 0.0920 | 0.0872 |
| ME3 BM4 | 0.0211 | 0.9911 | 0.7320 | 0.1063 | 0.2271 |
| ME3 BM5 | 0.0344 | 1.0543 | 0.6528 | 0.1176 | 0.2883 |
| ME4 BM1 | -0.0084 | 1.1800 | 0.8308 | 0.0779 | -0.1016 |
| ME4 BM2 | 0.0038 | 1.0577 | 0.8685 | 0.0886 | 0.0600 |
| ME4 BM3 | 0.0065 | 1.0068 | 0.8036 | 0.0914 | 0.0838 |
| ME4 BM4 | 0.0226 | 0.9803 | 0.7630 | 0.1080 | 0.2662 |
| ME4 BM5 | 0.0165 | 1.0484 | 0.6679 | 0.1007 | 0.1439 |
| BIG LoBM | 0.0103 | 0.9955 | 0.8935 | 0.0953 | 0.1926 |
| ME5 BM2 | 0.0071 | 0.9247 | 0.8631 | 0.0927 | 0.1249 |
| ME5 BM3 | 0.0052 | 0.8760 | 0.7904 | 0.0909 | 0.0743 |
| ME5 BM4 | -0.0048 | 0.9102 | 0.6863 | 0.0797 | -0.0501 |
| BIG HiBM | 0.0164 | 1.0260 | 0.6087 | 0.1009 | 0.1282 |
# Output from previous execution
Time-Series Test Plots
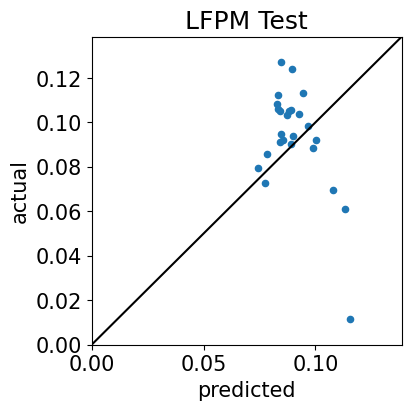
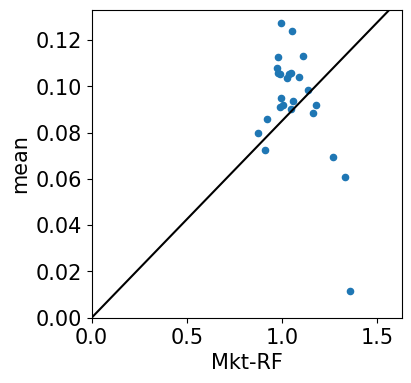
Cross-Sectional Test Plots
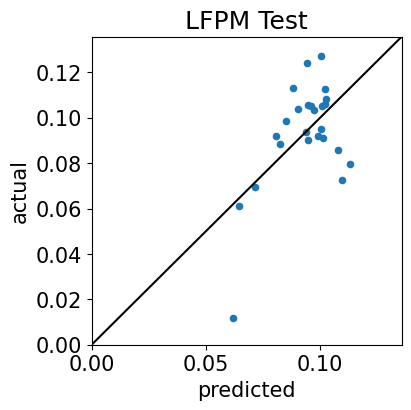
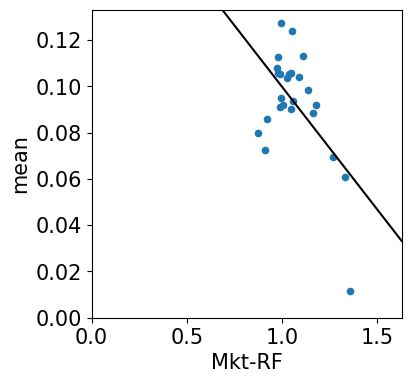
ESTIMATES
| premium-TS | premium-CS | |
|---|---|---|
| Mkt-RF | 0.0850 | -0.1059 |
| intercept | NaN | 0.2058 |
MODEL FIT
| MAE-TS | MAE-CS | rsquared | |
|---|---|---|---|
| error | 0.0207 | 0.0141 | 0.3132 |
STATISTICAL SIGNIFICANCE
| time-series | priced | premium |
|---|---|---|
| p-values | ||
| Mkt-RF | 0.0003 | 0.0001 |
| error | 0.0000 | NaN |
"premium" p-value is the usual t-stat on the time-series factor mean.
"priced" p-value of factor is the t-stat of forming the tangency portfolio.
"priced" p-value of "error" is the joint-chi-squared test of the time-series alphas
# Output from previous execution
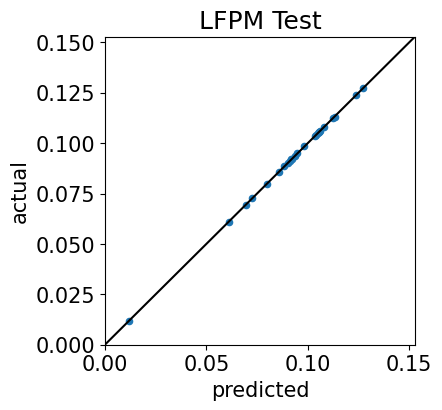
Time-Series Test Plots
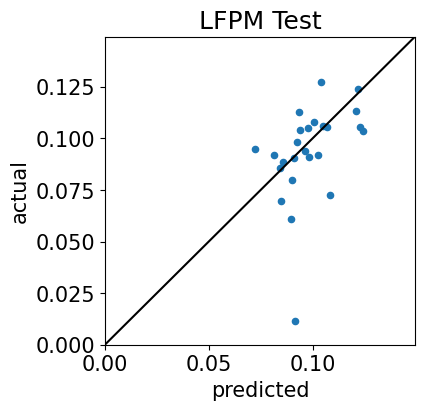
Cross-Sectional Test Plots
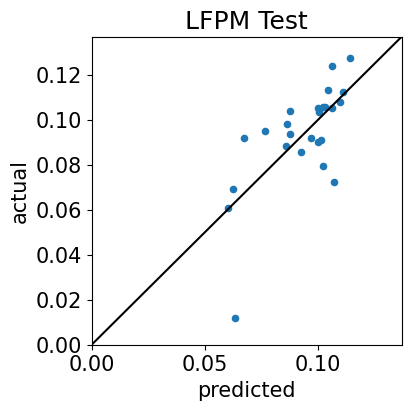
ESTIMATES
| premium-TS | premium-CS | |
|---|---|---|
| HML | 0.0310 | 0.0346 |
| Mkt-RF | 0.0850 | -0.0937 |
| SMB | 0.0033 | -0.0025 |
| intercept | NaN | 0.1800 |
MODEL FIT
| MAE-TS | MAE-CS | rsquared | |
|---|---|---|---|
| error | 0.0141 | 0.0114 | 0.4798 |
STATISTICAL SIGNIFICANCE
| time-series | priced | premium |
|---|---|---|
| p-values | ||
| Mkt-RF | 0.0001 | 0.0001 |
| SMB | 0.8189 | 0.4163 |
| HML | 0.0098 | 0.0282 |
| error | 0.0000 | NaN |
"premium" p-value is the usual t-stat on the time-series factor mean.
"priced" p-value of factor is the t-stat of forming the tangency portfolio.
"priced" p-value of "error" is the joint-chi-squared test of the time-series alphas
# Output from previous execution
Time-Series Test Plots
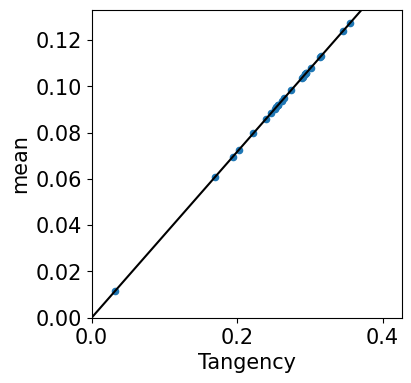
Cross-Sectional Test Plots
ESTIMATES
| premium-TS | premium-CS | |
|---|---|---|
| Tangency | 0.3584 | 0.3584 |
| intercept | NaN | 0.0000 |
MODEL FIT
| MAE-TS | MAE-CS | rsquared | |
|---|---|---|---|
| error | 0.0000 | 0.0000 | 1.0000 |
STATISTICAL SIGNIFICANCE
| time-series | priced | premium |
|---|---|---|
| p-values | ||
| Tangency | 0.0000 | 0.0000 |
| error | 1.0000 | NaN |
"premium" p-value is the usual t-stat on the time-series factor mean.
"priced" p-value of factor is the t-stat of forming the tangency portfolio.
"priced" p-value of "error" is the joint-chi-squared test of the time-series alphas