MV Optimization of the Harvard Endowment#
HBS Case#
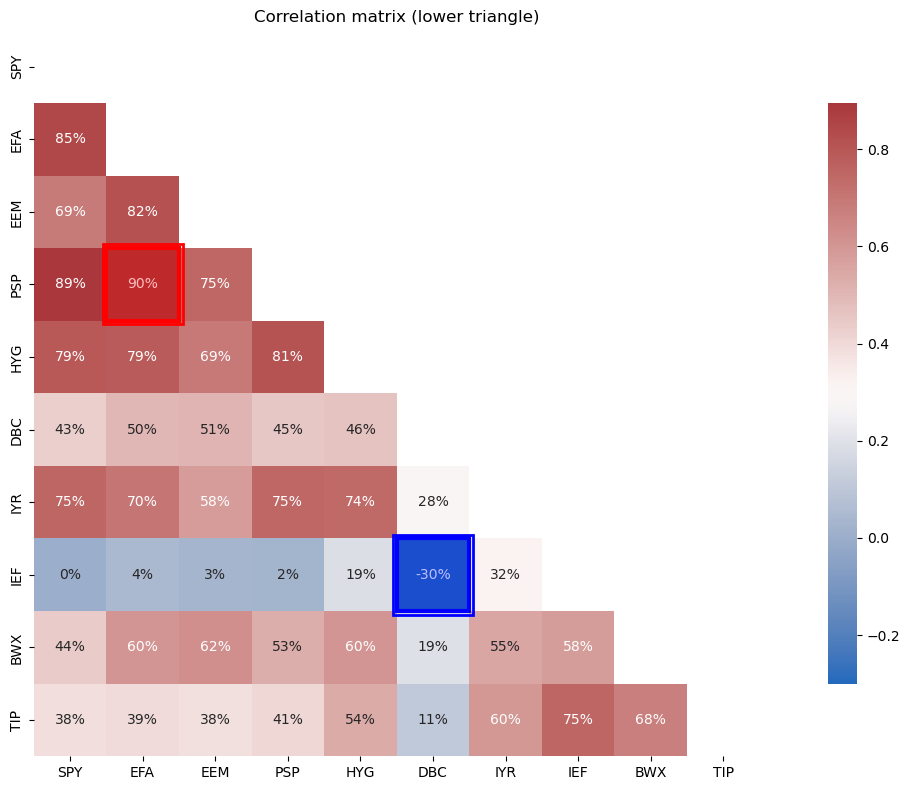
The Harvard Management Company and Inflation-Indexed Bonds#
# Output from previous execution
| shortName | quoteType | currency | volume | totalAssets | longBusinessSummary | |
|---|---|---|---|---|---|---|
| ticker | ||||||
| SPY | SPDR S&P 500 | ETF | USD | 24710239 | 603516960768 | The trust seeks to achieve its investment obje... |
| EFA | iShares MSCI EAFE ETF | ETF | USD | 4818965 | 63209721856 | The fund generally will invest at least 80% of... |
| EEM | iShares MSCI Emerging Index Fun | ETF | USD | 8563600 | 17162833920 | The fund generally will invest at least 80% of... |
| PSP | Invesco Global Listed Private E | ETF | USD | 3622 | 258060880 | The fund generally will invest at least 90% of... |
| QAI | NYLI Hedge Multi-Strategy Track | ETF | USD | 12559 | 696944896 | The fund is a "fund of funds" which means it i... |
| HYG | iShares iBoxx $ High Yield Corp | ETF | USD | 19724563 | 15944028160 | The underlying index is a rules-based index co... |
| DBC | Invesco DB Commodity Index Trac | ETF | USD | 184605 | 1142769792 | The fund pursues its investment objective by i... |
| IYR | iShares U.S. Real Estate ETF | ETF | USD | 2170005 | 3480166144 | The fund seeks to track the investment results... |
| IEF | iShares 7-10 Year Treasury Bond | ETF | USD | 5269754 | 34938195968 | The underlying index measures the performance ... |
| BWX | SPDR Bloomberg International Tr | ETF | USD | 155330 | 1423427840 | The fund generally invests substantially all, ... |
| TIP | iShares TIPS Bond ETF | ETF | USD | 1601034 | 13900867584 | The index tracks the performance of inflation-... |
| SHV | iShares Short Treasury Bond ETF | ETF | USD | 2043964 | 20599980032 | The fund will invest at least 80% of its asset... |
# Output from previous execution
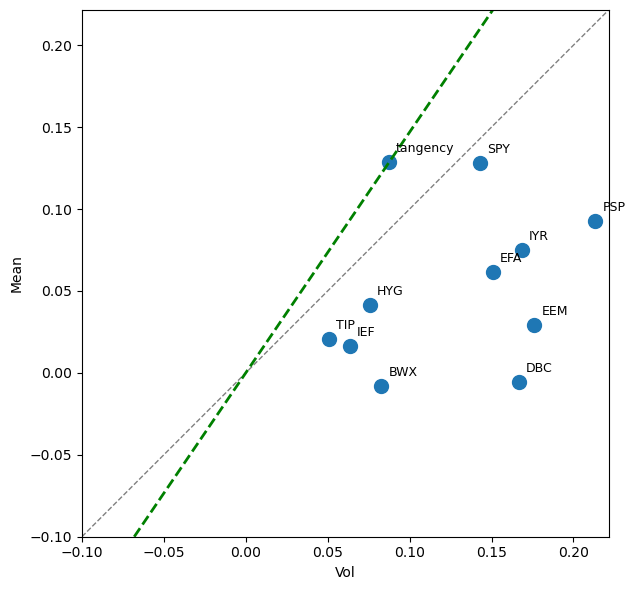
| Mean | Vol | Sharpe | Min | Max | |
|---|---|---|---|---|---|
| SPY | 12.8% | 14.3% | 89.7% | -12.9% | 12.7% |
| HYG | 4.1% | 7.6% | 54.5% | -10.4% | 8.6% |
| IYR | 7.5% | 16.9% | 44.4% | -20.0% | 13.3% |
| PSP | 9.3% | 21.3% | 43.4% | -27.8% | 17.9% |
| EFA | 6.2% | 15.1% | 40.9% | -14.5% | 14.3% |
| TIP | 2.1% | 5.1% | 40.1% | -6.7% | 4.3% |
| IEF | 1.6% | 6.3% | 25.9% | -4.7% | 4.7% |
| EEM | 2.9% | 17.6% | 16.7% | -17.9% | 16.3% |
| DBC | -0.5% | 16.7% | -3.2% | -17.7% | 10.3% |
| BWX | -0.8% | 8.3% | -9.3% | -6.9% | 7.8% |
# Output from previous execution
# Output from previous execution
| Value | |
|---|---|
| GMV mean (unscaled) | 0.22% |
| Tangency mean | 1.07% |
| Max |asset mean| | 1.07% |
# Output from previous execution
# Output from previous execution
# Output from previous execution
# Output from previous execution
| Mean | Vol | Sharpe | Min | Max | |
|---|---|---|---|---|---|
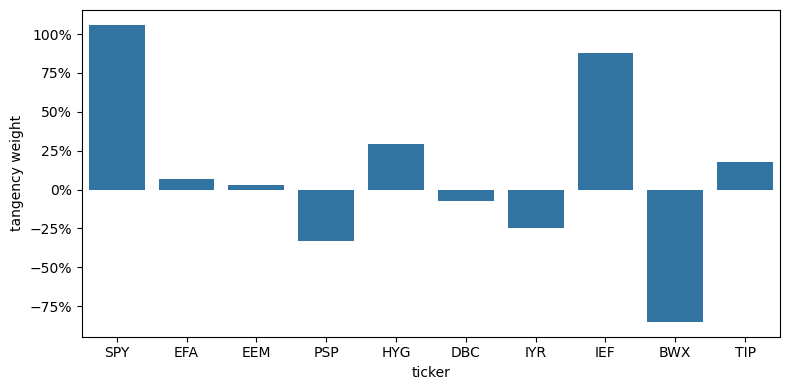
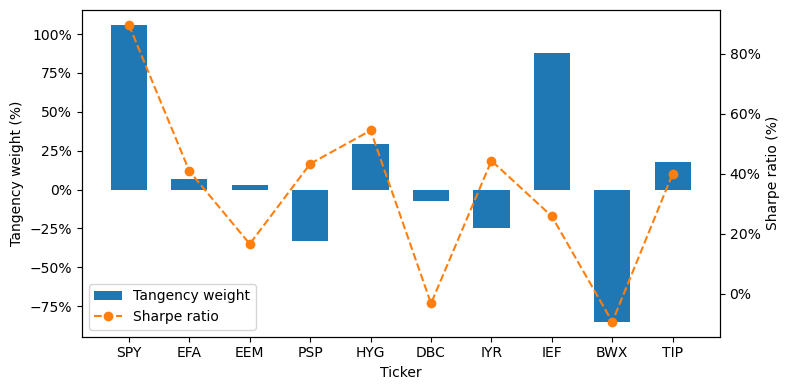
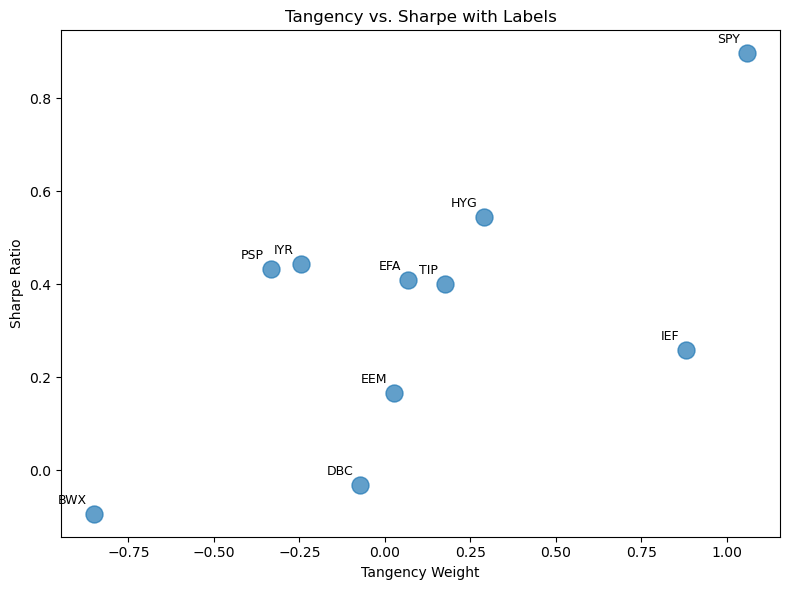
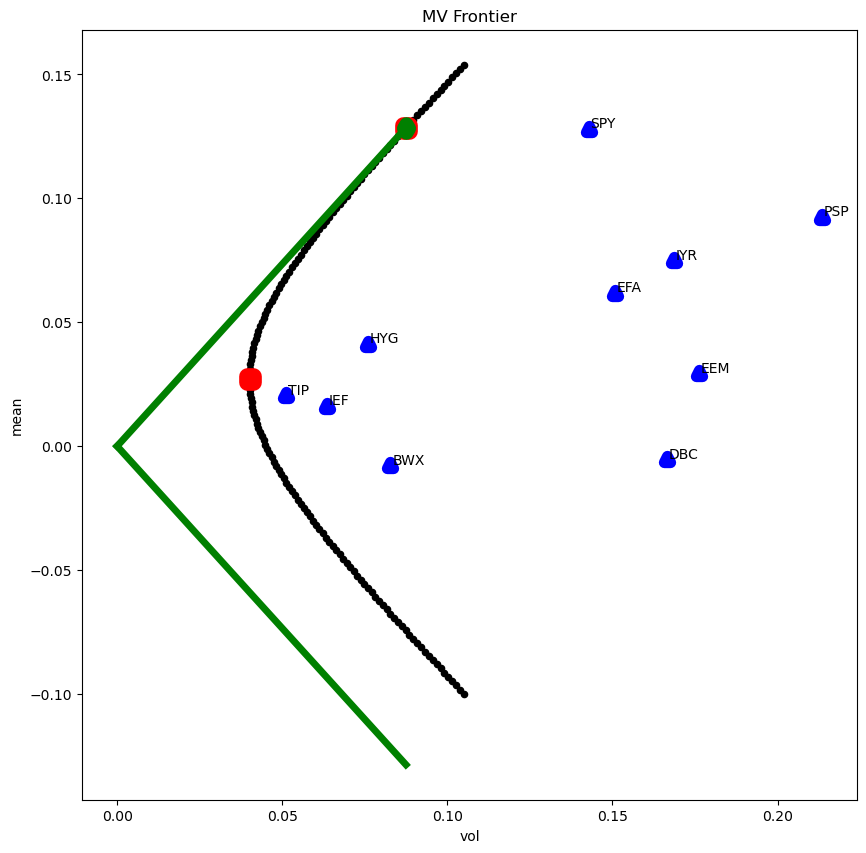
| tangency | 13% | 9% | 147% | -5% | 8% |
| SPY | 13% | 14% | 90% | -13% | 13% |
| HYG | 4% | 8% | 54% | -10% | 9% |
| IYR | 7% | 17% | 44% | -20% | 13% |
| PSP | 9% | 21% | 43% | -28% | 18% |
| EFA | 6% | 15% | 41% | -14% | 14% |
| TIP | 2% | 5% | 40% | -7% | 4% |
| IEF | 2% | 6% | 26% | -5% | 5% |
| EEM | 3% | 18% | 17% | -18% | 16% |
| DBC | -1% | 17% | -3% | -18% | 10% |
| BWX | -1% | 8% | -9% | -7% | 8% |
# Output from previous execution
# Output from previous execution
# Output from previous execution
# Output from previous execution
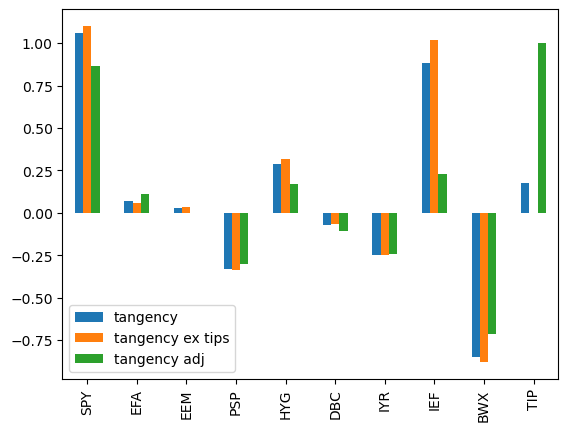
| Mean | Vol | Sharpe | Min | Max | |
|---|---|---|---|---|---|
| tangency | 0.1285 | 0.0875 | 1.4692 | -0.0508 | 0.0823 |
| tangency adj | 0.1187 | 0.0768 | 1.5457 | -0.0451 | 0.0838 |
# Output from previous execution
Standard error of mean of TIPS is equal to 0.11%
Proposed adjustment to mean of TIPS is  0.08%
# Output from previous execution
| Mean | Vol | Sharpe | Min | Max | |
|---|---|---|---|---|---|
| tangency | 12.0% | 8.2% | 146.9% | -4.7% | 7.7% |
| equal weights | 12.0% | 26.9% | 44.6% | -32.5% | 22.2% |
| risk parity | 12.0% | 26.4% | 45.5% | -28.0% | 19.3% |
| regularized | 12.0% | 10.6% | 113.6% | -7.5% | 11.0% |
# Output from previous execution
| in-sample | out-of-sample | |||||||||
|---|---|---|---|---|---|---|---|---|---|---|
| Mean | Vol | Sharpe | Min | Max | Mean | Vol | Sharpe | Min | Max | |
| tangency | 12.0% | 7.9% | 151.8% | -5.4% | 7.4% | 11.0% | 10.8% | 101.4% | -4.7% | 5.7% |
| equal weights | 12.0% | 27.1% | 44.3% | -31.7% | 21.6% | 9.0% | 17.2% | 52.1% | -8.1% | 6.0% |
| risk parity | 12.0% | 25.2% | 47.7% | -26.4% | 18.2% | 3.2% | 21.9% | 14.7% | -11.6% | 8.5% |
| regularized | 12.0% | 10.4% | 115.0% | -7.9% | 11.0% | 9.5% | 10.1% | 94.2% | -4.7% | 5.1% |
| tangency ex tips | 12.0% | 7.9% | 151.8% | -5.4% | 7.4% | 11.0% | 10.8% | 101.4% | -4.7% | 5.7% |
| tan tips adj | 12.0% | 8.2% | 146.7% | -5.0% | 8.7% | 11.5% | 10.3% | 111.5% | -4.4% | 5.4% |
# Output from previous execution
# Output from previous execution
| mean | vol | |
|---|---|---|
| excess | 12.9% | 8.7% |
| total | 1.6% | 0.8% |
# Output from previous execution
| rho | |
|---|---|
| tan | 73.3% |