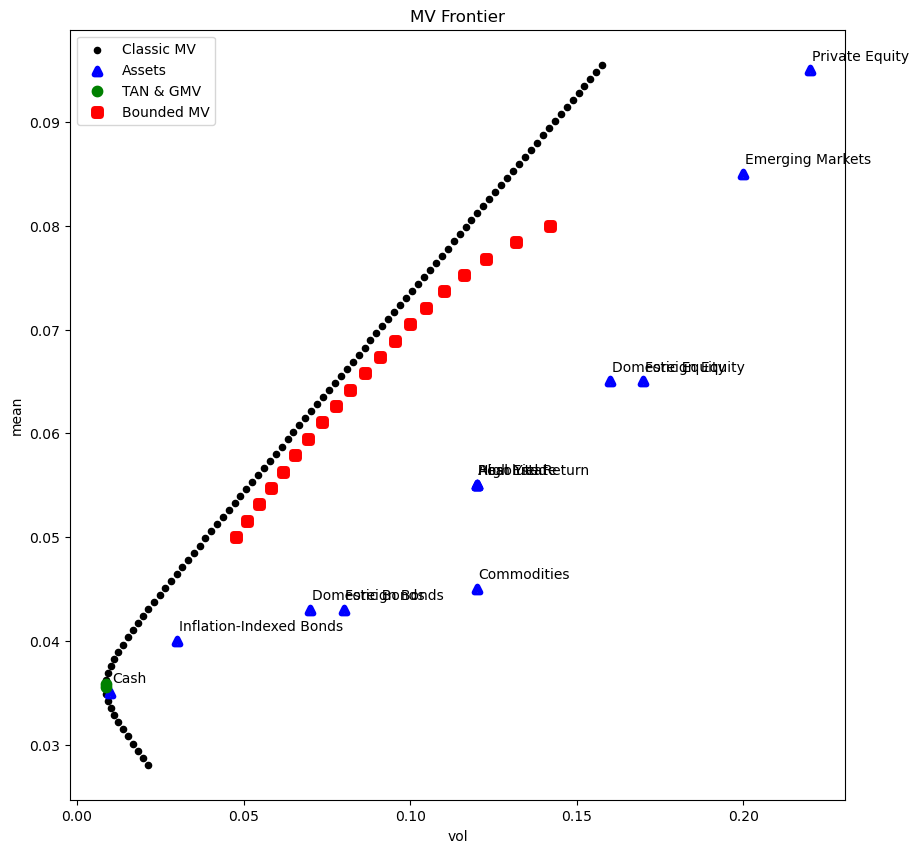
Constrained Optimization of the Harvard Endowment#
HBS Case#
The Harvard Management Company and Inflation-Indexed Bonds#
# Output from previous execution
Optimization SUCCESSFUL.
Iterations: 31.
# Output from previous execution
Optimization SUCCESSFUL.
Iterations: 63.
# Output from previous execution
| Equally-Weighted | Bounded: Numerical | Bounded: Case | MV: Numerical | MV: Analytic | |
|---|---|---|---|---|---|
| Domestic Equity | 8.33% | 22.00% | 22.00% | -0.05% | -0.05% |
| Foreign Equity | 8.33% | 5.00% | 5.00% | 5.74% | 5.74% |
| Emerging Markets | 8.33% | 19.00% | 19.00% | 19.87% | 19.87% |
| Private Equity | 8.33% | 22.83% | 22.80% | 22.01% | 22.01% |
| Absolute Return | 8.33% | -6.00% | -6.00% | -0.65% | -0.65% |
| High Yield | 8.33% | -6.92% | -6.90% | 4.15% | 4.15% |
| Commodities | 8.33% | 15.00% | 15.00% | 14.21% | 14.21% |
| Real Estate | 8.33% | 16.42% | 16.40% | 17.35% | 17.35% |
| Domestic Bonds | 8.33% | 1.00% | 1.00% | -19.98% | -19.98% |
| Foreign Bonds | 8.33% | 2.90% | 2.90% | 15.95% | 15.95% |
| Inflation-Indexed Bonds | 8.33% | 23.77% | 23.80% | 97.73% | 97.73% |
| Cash | 8.33% | -15.00% | -15.00% | -76.31% | -76.31% |
# Output from previous execution
| Min | Max | |
|---|---|---|
| Policy | ||
| Domestic Equity | 22.00% | 42.00% |
| Foreign Equity | 5.00% | 25.00% |
| Emerging Markets | -1.00% | 19.00% |
| Private Equity | 5.00% | 25.00% |
| Absolute Return | -6.00% | 14.00% |
| High Yield | -8.00% | 12.00% |
| Commodities | -5.00% | 15.00% |
| Real Estate | -3.00% | 17.00% |
| Domestic Bonds | 1.00% | 21.00% |
| Foreign Bonds | -5.00% | 15.00% |
| Inflation-Indexed Bonds | 0.00% | 100.00% |
| Cash | -15.00% | 5.00% |
# Output from previous execution
| mean | vol | Sharpe | |
|---|---|---|---|
| Equally-Weighted | 5.67% | 6.58% | 33.05% |
| Bounded: Numerical | 7.00% | 9.84% | 35.57% |
| Bounded: Case | 7.00% | 9.84% | 35.57% |
| MV: Numerical | 7.00% | 9.08% | 38.54% |
| MV: Analytic | 7.00% | 9.08% | 38.54% |
# Output from previous execution
| Lagrange Multipliers | |
|---|---|
| Assumed Stats | |
| Commodities | 0.14% |
| Emerging Markets | 0.08% |
| Real Estate | 0.00% |
| Private Equity | 0.00% |
| Inflation-Indexed Bonds | -0.00% |
| Foreign Bonds | -0.00% |
| High Yield | -0.00% |
| Absolute Return | -0.13% |
| Domestic Bonds | -0.16% |
| Foreign Equity | -0.17% |
| Cash | -0.18% |
| Domestic Equity | -0.68% |
# Output from previous execution