Solution to Barnstable and Long-Run Risk#
HBS Case#
The Risk of Stocks in the Long-Run: The Barnstable College Endowment#
# Output from previous execution
| 1965 - 1999 | 2000 - 2024 | 1926 - 2024 | |||||
|---|---|---|---|---|---|---|---|
| mean | vol | mean | vol | mean | vol | ||
| levels | SPX | 12.94% | 14.94% | 8.75% | 15.28% | 11.55% | 18.66% |
| TB1M | 6.15% | 0.72% | 1.75% | 0.56% | 3.19% | 0.85% | |
| excess_returns | 6.87% | 15.02% | 7.01% | 15.31% | 8.33% | 18.73% | |
| logs | SPX | 11.76% | 14.96% | 7.56% | 15.38% | 9.78% | 18.59% |
| TB1M | 6.13% | 0.71% | 1.74% | 0.55% | 3.18% | 0.85% | |
| excess_returns | 5.72% | 15.12% | 5.81% | 15.42% | 6.57% | 18.69% | |
# Output from previous execution
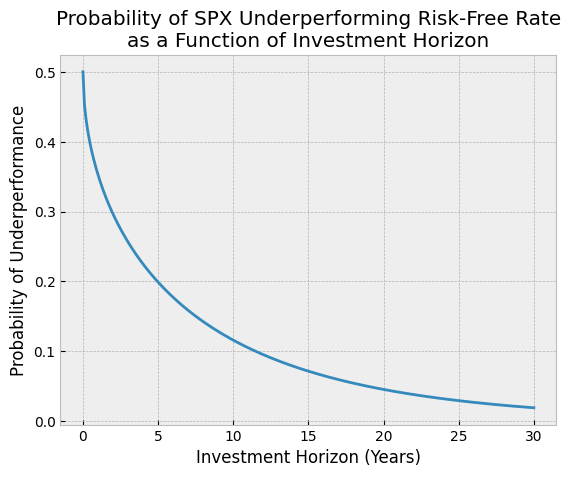
SPX underperforming risk-free rate in the 15 years after 1999: 7.16%
SPX underperforming risk-free rate in the 30 years after 1999: 1.92%
# Output from previous execution
SPX underperforming risk-free rate in the 30 years after 2024: 2.35%
# Output from previous execution
Probability of underperformance in 2000-2024: 8.42%