Solution to Smart Beta Factors#
# Output from previous execution
| MKT | SMB | HML | RMW | CMA | UMD | |
|---|---|---|---|---|---|---|
| date | ||||||
| 2025-06-30 | 0.0486 | -0.0002 | -0.0160 | -0.0319 | 0.0145 | -0.0264 |
| 2025-07-31 | 0.0198 | -0.0015 | -0.0127 | -0.0029 | -0.0207 | -0.0096 |
| 2025-08-31 | 0.0185 | 0.0488 | 0.0441 | -0.0069 | 0.0207 | -0.0354 |
# Output from previous execution
| Name | Unit | Construction | Description | |
|---|---|---|---|---|
| MKT | Market | Excess Return | Market-cap-weighted | US Equities |
| SMB | Size | Excess Return | Small Minus Big | Long small stocks and short big stocks |
| HML | Value | Excess Return | High Minus Low | Long value (high book-to-market) stocks and sh... |
| RMW | Profitability | Excess Return | Robust Minus Weak | Long profitability (income statement) and shor... |
| CMA | Investment | Excess Return | Conservative Minus Agressive | Long stocks with low (conservative) investment... |
| UMD | Momentum | Excess Return | Up Minus Down | Long stocks that have high recent returns and ... |
| RF | Risk-free rate | Total Return | Tbills | NaN |
# Output from previous execution
| Annualized Mean | Annualized Vol | Annualized Sharpe | |
|---|---|---|---|
| MKT | 0.0876 | 0.1561 | 0.5607 |
| RMW | 0.0440 | 0.0829 | 0.5311 |
| UMD | 0.0603 | 0.1534 | 0.3933 |
| CMA | 0.0283 | 0.0725 | 0.3903 |
| HML | 0.0260 | 0.1088 | 0.2392 |
| SMB | 0.0061 | 0.1013 | 0.0604 |
# Output from previous execution
| Annualized Mean | Annualized Vol | Annualized Sharpe | |
|---|---|---|---|
| MKT 1980-2001 | 0.0835 | 0.1592 | 0.5242 |
| SMB 1980-2001 | 0.0028 | 0.1092 | 0.0257 |
| HML 1980-2001 | 0.0528 | 0.1110 | 0.4751 |
| RMW 1980-2001 | 0.0487 | 0.0912 | 0.5341 |
| CMA 1980-2001 | 0.0460 | 0.0772 | 0.5958 |
| UMD 1980-2001 | 0.1088 | 0.1497 | 0.7272 |
| MKT 2002-2025 | 0.0914 | 0.1535 | 0.5952 |
| SMB 2002-2025 | 0.0092 | 0.0935 | 0.0984 |
| HML 2002-2025 | 0.0012 | 0.1064 | 0.0113 |
| RMW 2002-2025 | 0.0397 | 0.0745 | 0.5326 |
| CMA 2002-2025 | 0.0118 | 0.0676 | 0.1749 |
| UMD 2002-2025 | 0.0152 | 0.1558 | 0.0976 |
# Output from previous execution
# Output from previous execution
| Annualized Mean | Annualized Vol | Annualized Sharpe | |
|---|---|---|---|
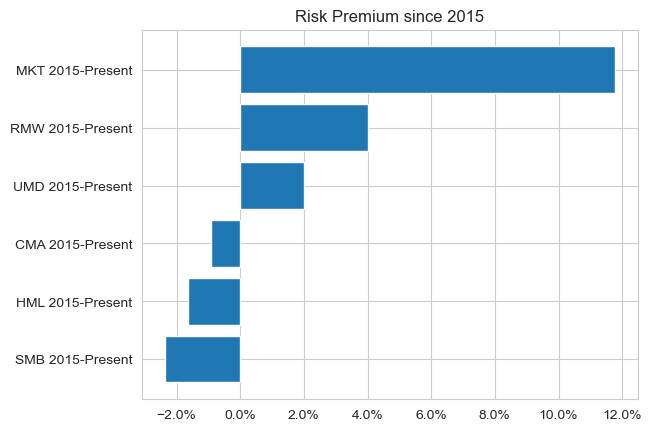
| MKT 2015-Present | 0.1179 | 0.1574 | 0.7491 |
| RMW 2015-Present | 0.0400 | 0.0726 | 0.5509 |
| UMD 2015-Present | 0.0201 | 0.1374 | 0.1464 |
| CMA 2015-Present | -0.0091 | 0.0821 | -0.1114 |
| HML 2015-Present | -0.0163 | 0.1299 | -0.1255 |
| SMB 2015-Present | -0.0238 | 0.1032 | -0.2305 |
# Output from previous execution
# Output from previous execution
# Output from previous execution
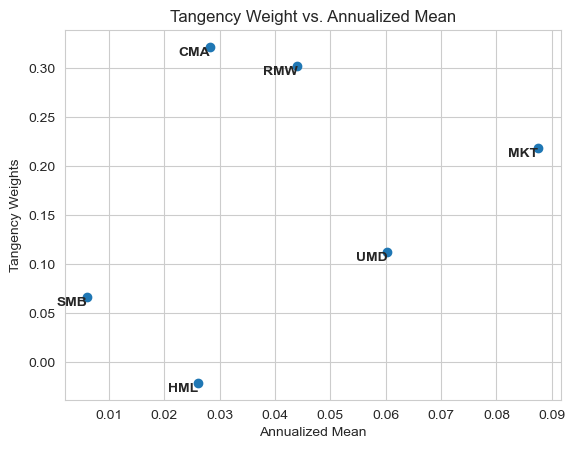
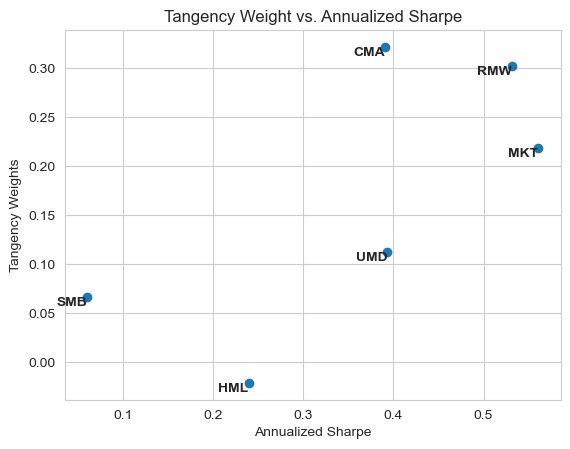
| Tangency Weights | Annualized Mean | Annualized Sharpe | |
|---|---|---|---|
| CMA | 0.3214 | 0.0283 | 0.3903 |
| RMW | 0.3018 | 0.0440 | 0.5311 |
| MKT | 0.2186 | 0.0876 | 0.5607 |
| UMD | 0.1125 | 0.0603 | 0.3933 |
| SMB | 0.0668 | 0.0061 | 0.0604 |
| HML | -0.0212 | 0.0260 | 0.2392 |
# Output from previous execution
# Output from previous execution
# Output from previous execution
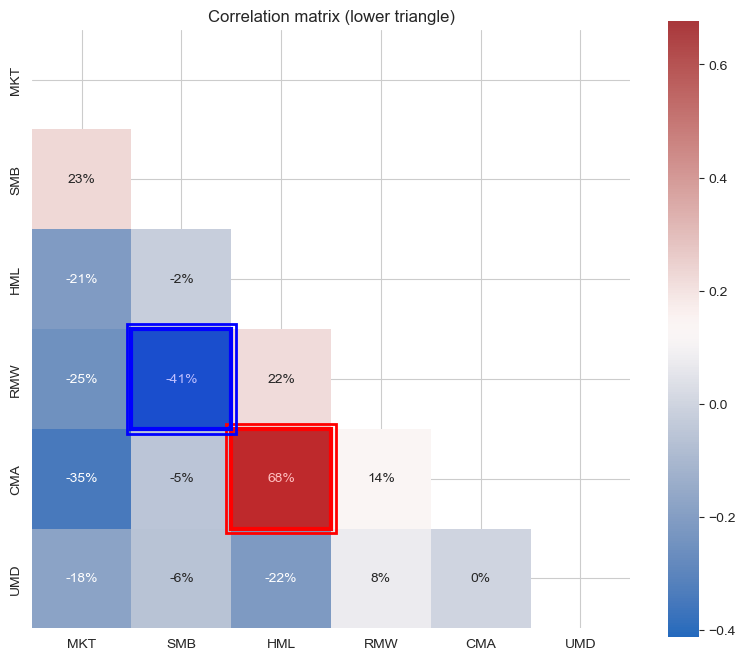
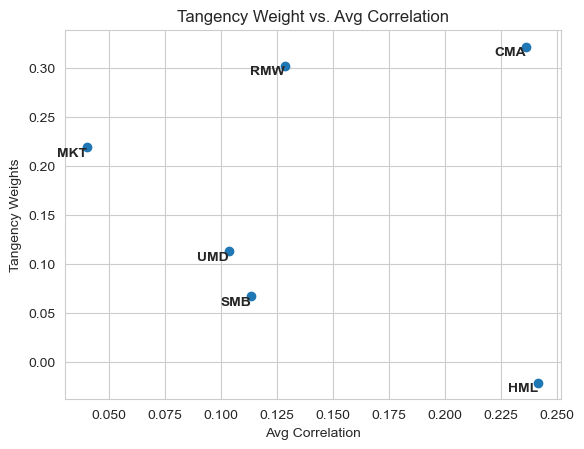
| Tangency Weights | Annualized Mean | Annualized Sharpe | Avg Correlation | MKT Correlation | SMB Correlation | HML Correlation | RMW Correlation | CMA Correlation | UMD Correlation | |
|---|---|---|---|---|---|---|---|---|---|---|
| CMA | 32.1% | 2.8% | 39.0% | 23.6% | -34.7% | -5.1% | 67.7% | 13.9% | 100.0% | 0.0% |
| RMW | 30.2% | 4.4% | 53.1% | 12.9% | -25.1% | -41.2% | 21.9% | 100.0% | 13.9% | 7.7% |
| MKT | 21.9% | 8.8% | 56.1% | 4.0% | 100.0% | 22.7% | -20.8% | -25.1% | -34.7% | -17.9% |
| UMD | 11.2% | 6.0% | 39.3% | 10.3% | -17.9% | -6.1% | -21.6% | 7.7% | 0.0% | 100.0% |
| SMB | 6.7% | 0.6% | 6.0% | 11.4% | 22.7% | 100.0% | -2.2% | -41.2% | -5.1% | -6.1% |
| HML | -2.1% | 2.6% | 23.9% | 24.2% | -20.8% | -2.2% | 100.0% | 21.9% | 67.7% | -21.6% |
# Output from previous execution
# Output from previous execution
| Tangency Weights with 4 Factors | Tangency Weights with 6 Factors | |
|---|---|---|
| MKT | 0.3765 | 0.2186 |
| SMB | -0.0512 | 0.0668 |
| HML | 0.3653 | -0.0212 |
| UMD | 0.3094 | 0.1125 |
| RMW | NaN | 0.3018 |
| CMA | NaN | 0.3214 |
# Output from previous execution
| Annualized Mean | Annualized Vol | Annualized Sharpe | |
|---|---|---|---|
| Tangency Portfolio with 4 Factors Portfolio | 0.0608 | 0.0666 | 0.9138 |
| Tangency Portfolio with 6 Factors Portfolio | 0.0482 | 0.0401 | 1.2013 |
| Tangency Portfolio without HML Portfolio | 0.0482 | 0.0402 | 1.2003 |
# Output from previous execution
| Agric | Food | Soda | Beer | Smoke | Toys | Fun | Books | Hshld | Clths | ... | Boxes | Trans | Whlsl | Rtail | Meals | Banks | Insur | RlEst | Fin | Other | |
|---|---|---|---|---|---|---|---|---|---|---|---|---|---|---|---|---|---|---|---|---|---|
| date | |||||||||||||||||||||
| 2025-04-30 | -0.0103 | -0.0214 | 0.0116 | -0.0616 | 0.0483 | -0.0671 | 0.1377 | 0.0164 | -0.0383 | -0.0801 | ... | -0.0179 | -0.0308 | 0.0163 | 0.0097 | -0.0299 | -0.0245 | -0.0851 | -0.0792 | -0.0054 | -0.0030 |
| 2025-05-31 | 0.1264 | -0.0326 | -0.0009 | -0.0382 | 0.0424 | 0.0517 | 0.0615 | 0.0380 | 0.0372 | 0.0989 | ... | 0.0211 | 0.0689 | 0.0200 | 0.0609 | 0.0330 | 0.0706 | -0.0499 | 0.0089 | 0.0752 | 0.0009 |
| 2025-06-30 | 0.0500 | -0.0170 | -0.0117 | -0.0201 | 0.0041 | 0.0627 | 0.0992 | 0.0327 | -0.0425 | 0.0167 | ... | 0.0143 | 0.0441 | 0.0121 | 0.0241 | 0.0162 | 0.0616 | -0.0028 | 0.1014 | 0.0819 | -0.0192 |
| 2025-07-31 | -0.0228 | -0.0072 | -0.0446 | 0.0304 | -0.0618 | 0.0147 | -0.0908 | -0.0367 | -0.0344 | 0.0216 | ... | -0.0076 | -0.0239 | -0.0020 | 0.0278 | -0.0285 | 0.0048 | -0.1008 | 0.1033 | 0.0415 | -0.0266 |
| 2025-08-31 | 0.0243 | -0.0025 | 0.0305 | 0.0311 | 0.0349 | 0.0651 | 0.0462 | 0.0531 | 0.0289 | 0.0387 | ... | 0.0161 | 0.0383 | 0.0116 | 0.0047 | 0.0050 | 0.0473 | 0.0711 | 0.0541 | -0.0058 | 0.0407 |
5 rows × 49 columns
# Output from previous execution
| Alpha | Annualized Alpha | R-Squared | |
|---|---|---|---|
| Agric | 0.0010 | 0.0117 | 0.3421 |
| Food | 0.0001 | 0.0015 | 0.4551 |
| Soda | 0.0013 | 0.0154 | 0.3025 |
| Beer | 0.0008 | 0.0099 | 0.4148 |
| Smoke | 0.0034 | 0.0411 | 0.2654 |
| Toys | -0.0028 | -0.0337 | 0.5102 |
| Fun | 0.0033 | 0.0391 | 0.6072 |
| Books | -0.0031 | -0.0367 | 0.6889 |
| Hshld | -0.0011 | -0.0127 | 0.5547 |
| Clths | -0.0019 | -0.0227 | 0.6190 |
| Hlth | -0.0034 | -0.0407 | 0.4409 |
| MedEq | 0.0014 | 0.0164 | 0.5958 |
| Drugs | 0.0021 | 0.0256 | 0.4894 |
| Chems | -0.0029 | -0.0351 | 0.7452 |
| Rubbr | -0.0004 | -0.0045 | 0.6453 |
| Txtls | -0.0031 | -0.0367 | 0.5470 |
| BldMt | -0.0024 | -0.0286 | 0.7525 |
| Cnstr | -0.0029 | -0.0353 | 0.6315 |
| Steel | -0.0027 | -0.0324 | 0.6283 |
| FabPr | -0.0024 | -0.0287 | 0.4245 |
| Mach | -0.0004 | -0.0053 | 0.7540 |
| ElcEq | -0.0004 | -0.0048 | 0.7372 |
| Autos | 0.0011 | 0.0127 | 0.5278 |
| Aero | -0.0006 | -0.0070 | 0.5994 |
| Ships | -0.0032 | -0.0389 | 0.5046 |
| Guns | 0.0003 | 0.0041 | 0.3245 |
| Gold | 0.0013 | 0.0151 | 0.0495 |
| Mines | -0.0016 | -0.0196 | 0.4589 |
| Coal | -0.0033 | -0.0396 | 0.2126 |
| Oil | -0.0024 | -0.0288 | 0.4556 |
| Util | 0.0003 | 0.0040 | 0.3614 |
| Telcm | 0.0005 | 0.0062 | 0.5804 |
| PerSv | -0.0041 | -0.0496 | 0.5848 |
| BusSv | -0.0007 | -0.0081 | 0.8463 |
| Hardw | 0.0035 | 0.0420 | 0.6669 |
| Softw | 0.0057 | 0.0684 | 0.7450 |
| Chips | 0.0053 | 0.0636 | 0.7498 |
| LabEq | 0.0017 | 0.0201 | 0.7279 |
| Paper | -0.0036 | -0.0430 | 0.6730 |
| Boxes | -0.0003 | -0.0041 | 0.5829 |
| Trans | -0.0019 | -0.0226 | 0.7088 |
| Whlsl | -0.0014 | -0.0166 | 0.7523 |
| Rtail | 0.0018 | 0.0211 | 0.6866 |
| Meals | -0.0002 | -0.0028 | 0.6371 |
| Banks | -0.0018 | -0.0211 | 0.7740 |
| Insur | -0.0013 | -0.0154 | 0.6612 |
| RlEst | -0.0043 | -0.0511 | 0.6054 |
| Fin | 0.0016 | 0.0197 | 0.8129 |
| Other | -0.0035 | -0.0422 | 0.5837 |
# Output from previous execution
Lambda represents the premium calculated by the cross-section regression and the historical premium is the average of the factor excess returns
| TS MAE | TS Annualized MAE | |
|---|---|---|
| MKT + HML + RMW + UMD Cross-Section Regression | 0.0021 | 0.0246 |
# Output from previous execution
AQR Time-Series Average Absolute Alpha: 0.0021
AQR Time-Series Average Absolute Annualized Alpha: 0.0246
# Output from previous execution
Lambda represents the premium calculated by the cross-section regression and the historical premium is the average of the factor excess returns
Lambda represents the premium calculated by the cross-section regression and the historical premium is the average of the factor excess returns
Lambda represents the premium calculated by the cross-section regression and the historical premium is the average of the factor excess returns
Lambda represents the premium calculated by the cross-section regression and the historical premium is the average of the factor excess returns
| Eta | Annualized Eta | R-Squared | TS MAE | TS Annualized MAE | CS MAE | CS Annualized MAE | |
|---|---|---|---|---|---|---|---|
| FF5 Cross-Section Regression | 0.0050 | 0.0599 | 0.3765 | 0.0026 | 0.0314 | 0.0010 | 0.0120 |
| FF3 Cross-Section Regression | 0.0052 | 0.0627 | 0.3504 | 0.0020 | 0.0244 | 0.0010 | 0.0120 |
| AQR Cross-Section Regression | 0.0063 | 0.0755 | 0.2066 | 0.0021 | 0.0246 | 0.0011 | 0.0136 |
| CAPM Cross-Section Regression | 0.0069 | 0.0832 | 0.0093 | 0.0017 | 0.0210 | 0.0013 | 0.0152 |
# Output from previous execution
| CAPM Weights | AQR Weights | FF3 Weights | FF5 Weights | |
|---|---|---|---|---|
| MKT | 1.0000 | 0.2765 | 0.6142 | 0.2273 |
| HML | NaN | 0.1836 | 0.5019 | -0.0989 |
| RMW | NaN | 0.3546 | NaN | 0.3687 |
| UMD | NaN | 0.1853 | NaN | NaN |
| SMB | NaN | NaN | -0.1161 | 0.0806 |
| CMA | NaN | NaN | NaN | 0.4223 |
# Output from previous execution
| FF5 + Momentum Weights | FF3 + Momentum Weights | |
|---|---|---|
| MKT | 0.2186 | 0.3765 |
| HML | -0.0212 | 0.3653 |
| SMB | 0.0668 | -0.0512 |
| RMW | 0.3018 | NaN |
| CMA | 0.3214 | NaN |
| UMD | 0.1125 | 0.3094 |
# Output from previous execution
| CAPM R-Squared | AQR R-Squared | FF3 R-Squared | FF5 R-Squared | |
|---|---|---|---|---|
| Aero | 0.5431 | 0.5994 | 0.5776 | 0.5971 |
| Agric | 0.3333 | 0.3421 | 0.3573 | 0.3619 |
| Autos | 0.4828 | 0.5278 | 0.5014 | 0.5030 |
| Banks | 0.6126 | 0.7740 | 0.7666 | 0.7819 |
| Beer | 0.3244 | 0.4148 | 0.3518 | 0.4336 |
| BldMt | 0.6949 | 0.7525 | 0.7492 | 0.7800 |
| Books | 0.6551 | 0.6889 | 0.6911 | 0.7022 |
| Boxes | 0.5549 | 0.5829 | 0.5683 | 0.5787 |
| BusSv | 0.8439 | 0.8463 | 0.8687 | 0.8736 |
| Chems | 0.6845 | 0.7452 | 0.7284 | 0.7461 |
| Chips | 0.6714 | 0.7498 | 0.7323 | 0.7461 |
| Clths | 0.5607 | 0.6190 | 0.5739 | 0.6291 |
| Cnstr | 0.6107 | 0.6315 | 0.6552 | 0.6728 |
| Coal | 0.1926 | 0.2126 | 0.2315 | 0.2342 |
| Drugs | 0.4666 | 0.4894 | 0.4995 | 0.5190 |
| ElcEq | 0.7351 | 0.7372 | 0.7394 | 0.7420 |
| FabPr | 0.4010 | 0.4245 | 0.5041 | 0.5174 |
| Fin | 0.7713 | 0.8129 | 0.7947 | 0.8209 |
| Food | 0.3541 | 0.4551 | 0.4041 | 0.4781 |
| Fun | 0.5861 | 0.6072 | 0.5952 | 0.5995 |
| Gold | 0.0488 | 0.0495 | 0.0556 | 0.0691 |
| Guns | 0.2483 | 0.3245 | 0.2727 | 0.3351 |
| Hardw | 0.5946 | 0.6669 | 0.6354 | 0.6541 |
| Hlth | 0.4058 | 0.4409 | 0.4351 | 0.4905 |
| Hshld | 0.4862 | 0.5547 | 0.5043 | 0.5819 |
| Insur | 0.5518 | 0.6612 | 0.6573 | 0.6653 |
| LabEq | 0.6806 | 0.7279 | 0.7477 | 0.7534 |
| Mach | 0.7400 | 0.7540 | 0.7728 | 0.7731 |
| Meals | 0.5816 | 0.6371 | 0.5919 | 0.6470 |
| MedEq | 0.5855 | 0.5958 | 0.5955 | 0.6045 |
| Mines | 0.4269 | 0.4589 | 0.4667 | 0.4726 |
| Oil | 0.3584 | 0.4556 | 0.4508 | 0.4619 |
| Other | 0.5770 | 0.5837 | 0.5810 | 0.5844 |
| Paper | 0.5991 | 0.6730 | 0.6381 | 0.6858 |
| PerSv | 0.5593 | 0.5848 | 0.5863 | 0.6197 |
| RlEst | 0.5268 | 0.6054 | 0.6735 | 0.6908 |
| Rtail | 0.6643 | 0.6866 | 0.6666 | 0.6889 |
| Rubbr | 0.6343 | 0.6453 | 0.6837 | 0.7044 |
| Ships | 0.4482 | 0.5046 | 0.4999 | 0.5369 |
| Smoke | 0.1821 | 0.2654 | 0.2312 | 0.2944 |
| Soda | 0.2449 | 0.3025 | 0.2734 | 0.3064 |
| Softw | 0.6270 | 0.7450 | 0.7454 | 0.7547 |
| Steel | 0.5857 | 0.6283 | 0.6405 | 0.6450 |
| Telcm | 0.5661 | 0.5804 | 0.5829 | 0.5917 |
| Toys | 0.4963 | 0.5102 | 0.5305 | 0.5509 |
| Trans | 0.6672 | 0.7088 | 0.6955 | 0.7210 |
| Txtls | 0.4311 | 0.5470 | 0.5863 | 0.6183 |
| Util | 0.2723 | 0.3614 | 0.3609 | 0.3805 |
| Whlsl | 0.7393 | 0.7523 | 0.7741 | 0.7974 |
# Output from previous execution
| Avg R-Squared | |
|---|---|
| FF5 | 0.5918 |
| AQR | 0.5719 |
| FF3 | 0.5679 |
| CAPM | 0.5226 |
# Output from previous execution
| CAPM | AQR | FF3 | FF5 | |||||
|---|---|---|---|---|---|---|---|---|
| Premium | Cross-Sectional | Historical | Cross-Sectional | Historical | Cross-Sectional | Historical | Cross-Sectional | Historical |
| Factor | ||||||||
| CMA | NaN | NaN | NaN | NaN | NaN | NaN | -0.0221 | 0.0283 |
| HML | NaN | NaN | -0.0323 | 0.0260 | -0.0210 | 0.0260 | -0.0259 | 0.0260 |
| MKT | 0.0079 | 0.0876 | 0.0172 | 0.0876 | 0.0388 | 0.0876 | 0.0403 | 0.0876 |
| RMW | NaN | NaN | 0.0175 | 0.0440 | NaN | NaN | 0.0187 | 0.0440 |
| SMB | NaN | NaN | NaN | NaN | -0.0396 | 0.0061 | -0.0414 | 0.0061 |
| UMD | NaN | NaN | 0.0003 | 0.0603 | NaN | NaN | NaN | NaN |
# Output from previous execution
| Eta | Annualized Eta | R-Squared | MKT Lambda | Treynor Ratio | Annualized Treynor Ratio | MKT Annualized Lambda | MKT Historical Premium | MKT Annualized Historical Premium | TS MAE | ... | RMW Annualized Historical Premium | UMD Annualized Historical Premium | SMB Lambda | SMB Annualized Lambda | SMB Historical Premium | SMB Annualized Historical Premium | CMA Lambda | CMA Annualized Lambda | CMA Historical Premium | CMA Annualized Historical Premium | |
|---|---|---|---|---|---|---|---|---|---|---|---|---|---|---|---|---|---|---|---|---|---|
| CAPM Cross-Section Regression | 0.0069 | 0.0832 | 0.0093 | 0.0007 | 11.5196 | 138.2352 | 0.0079 | 0.0073 | 0.0876 | 0.0017 | ... | NaN | NaN | NaN | NaN | NaN | NaN | NaN | NaN | NaN | NaN |
| AQR Cross-Section Regression | 0.0063 | 0.0755 | 0.2066 | 0.0014 | NaN | NaN | 0.0172 | 0.0073 | 0.0876 | 0.0021 | ... | 0.0440 | 0.0603 | NaN | NaN | NaN | NaN | NaN | NaN | NaN | NaN |
| FF3 Cross-Section Regression | 0.0052 | 0.0627 | 0.3504 | 0.0032 | NaN | NaN | 0.0388 | 0.0073 | 0.0876 | 0.0020 | ... | NaN | NaN | -0.0033 | -0.0396 | 0.0005 | 0.0061 | NaN | NaN | NaN | NaN |
| FF5 Cross-Section Regression | 0.0050 | 0.0599 | 0.3765 | 0.0034 | NaN | NaN | 0.0403 | 0.0073 | 0.0876 | 0.0026 | ... | 0.0440 | NaN | -0.0035 | -0.0414 | 0.0005 | 0.0061 | -0.0018 | -0.0221 | 0.0024 | 0.0283 |
4 rows × 33 columns
# Output from previous execution
| TS Annualized MAE | CS Annualized MAE | |
|---|---|---|
| CAPM | 0.0210 | 0.0152 |
| AQR | 0.0246 | 0.0136 |
| FF3 | 0.0244 | 0.0120 |
| FF5 | 0.0314 | 0.0120 |