GMO#
Case: Grantham, Mayo, and Van Otterloo, 2012: Estimating the Equity Risk Premium [9-211-051].
1 READING: GMO#
This section is not graded, and you do not need to submit your answers. But you are expected to consider these issues and be ready to discuss them.
GMO’s approach.
Why does GMO believe they can more easily predict long‑run than short‑run asset‑class performance?
GMO believes that “in the short run, the market is a voting machine, but in the long run, the market is a weighing machine”. So specifically, they thing that in the long run, asset returns should converge to their fundamental values (“steady state”), but that in the short run there may be significant deviation from said values due to noise. They also believe that there is a long-run equity risk premia, ie. that equities should outperform bonds in the long run because of the “inconvenient return path” (they tend to lose value when you least want them to).
What predicting variables does the case mention are used by GMO? Does this fit with the goal of long‑run forecasts?
The case mentions dividend yield, P/E (Price/Earnings) multiple expansion and contraction, sales growth, and profit margin as predicting variables used by GMO. GMO believes that profit margin and P/E multiple should be stable in the long-run, and that long-run returns are principally driven by sales growth and required dividend yield. They also used the “Gordon Growth Model” as a basis for their forecasts.
This does fit the goal of long-run forecasts; using things other than purely price (so more fundamental drivers) helps avoid market noise that may affect short-term prices but not long-term values.
How has this approach led to contrarian positions?
Because they think that P/E multiples and dividend yield should be stable and reverting to some fundamental value, it means that when equity markets have elevated multiples or are frothy (lots of buyers), they will take an underweight position.
They were also typically more conservative, but took large risks when the “fat pitch” presented itself. They also heavily believed in a value-oriented approach to asset allocation, and had a lot of dry powder to deploy when the opportunity came (cash).
How does this approach raise business risk and managerial career risk?
The first risk, business risk, is a result of a fund needing to secure capital long enough to see its thesis become realized. As a contrarian with a long term perspective, GMO is likely to suffer from severe underperformance while it waits for its thesis to play out. Many investors are not patient enough and may withrdraw their money, leaving GMO with no ability to function at all. In particular, GMO was bearish from 1997 and 2000, and lost 60% of their assets due to withdrawals.
Secondly, there is career risk. The risk here is that many investment professionals are driven by their concern for their position, which is largely determined by short(er) term performance. One may be reluctant to stand out if the risk of them, and them alone, being wrong leads to them being fired.
The market environment.
We often estimate the market risk premium by looking at a large sample of historic data. What reasons does the case give to be skeptical that the market risk premium will be as high in the future as it has been over the past 50 years?
GMO had a bearish outlook on stocks, with stocks only outperforming bonds by 1.6% over the next 7 years (as of 2011, Exhibit 10). The case mentions that even after 2008, PE ratios were at 19.9, well above the long-run average of 16. They were also “skeptical that US firms could sustain the record profit margins they had delivered since 2009, GMO was also pessimistic about future earnings growth. However, over the longer run, GMO was confident that stocks would continue to earn a healthy risk premium. Inker thought that ‘reports of the death of equities had been greatly exagerated.’”
In 2007, GMO forecasts real excess equity returns will be negative. What are the biggest drivers of their pessimistic conditional forecast relative to the unconditional forecast? (See Exhibit 9.)
From exhibit 9, they expected P/E to contract by 2.8% over the next 7 years, they also expected profit margins to contract by 3.9%. These were the two biggest drivers of their pessimistic forecast.
For the unconditional (steady state) forecast, they expected no change in P/E or profit margins relative to their historic steady states (16 and 6%, respectively).
In the 2011 forecast, what components has GMO revised most relative to 2007? Now how does their conditional forecast compare to the unconditional? (See Exhibit 10.)
In 2011, they expected PE ratios to not change (0.0%), a big revision from the -2.8% in 2007. In 2011 the PE ratio was 15, and they actually downgraded their unconditional forecast down 15 (from 16). They also slightly revised their profit margin contraction to 3.7%, up from 3.9% in 2007. Finally, they revised their expected sales growth per share up to 2.9%, up from 2.4% in 2007. This meant that their overall forecast was now 1.6% excess return over bonds, up signfificantly from -3.9% in 2007.
Consider the asset‑class forecasts in Exhibit 1.
Which asset class did GMO estimate to have a negative 10‑year return over 2002–2011? They only expected the S&P 500 to have a negative return of ~-1% per year over the next 10 years.
Which asset classes substantially outperformed GMO’s estimate over that time period? Foreign government bonds, and emerging market equities. For foreign government bonds, they expected a return of ~3% but they returned 6%, and for emerging market equities they expected ~9.5% but they returned ~11.5%. There’s also an argument to be made for US large cap equities, they expected -1% but they actually returned about 0.5%.
Which asset classes substantially underperformed GMO’s estimate over that time period? US Treasury bills, forecast 2% but returns -0.5%. Also, US REITs, they forecast a little over 8% but they returned ~6.5%.
Fund performance.
In which asset class was GMWAX most heavily allocated throughout the majority of 1997–2011?
Comment on the performance of GMWAX versus its benchmark. (No calculation needed; simply comment on the comparison in the exhibits.)
2 Analyzing GMO’s Flagship Fund#
Data#
This section utilizes data in the file gmo_returns_weekly.xlsx.
gmo: total returns on two GMO fundsbenchmarks: ETFs spanning the asset classes considered in the caseindexes: two indexes which are listed in the description ofGMWAXinfo: more info on the
Use SHV as the risk-free rate to calculate the excess returns.
# Output from previous execution
| Name | Company Description | Fund Total Assets | Dividend Yield | |
|---|---|---|---|---|
| Ticker | ||||
| GMWAX | GMO Global Asset Allocation Fu | GMO Global Asset Allocation Fund seeks total return greater than that of it... | $466 | 4.24% |
| GBMFX | GMO Benchmark-Free Allocation | GMO Benchmark-Free Allocation Fund seeks a positive return by investing in ... | $2,427 | 4.31% |
| GQETX | GMO Quality Fund | GMO Quality Fund seeks total return by investing in equities believed to be... | $11,914 | 6.48% |
| GMGEX | GMO Global Equity Allocation F | GMO Global Equity Allocation Fund seeks a total return greater than its ben... | $610 | 4.30% |
| SPY | SPDR S&P 500 ETF Trust | SPDR S&P 500 ETF Trust is an exchange-traded fund incorporated in the USA. ... | $693,035 | 1.08% |
| EFA | iShares MSCI EAFE ETF | iShares MSCI EAFE ETF is an exchange-traded fund incorporated in the USA. T... | $68,792 | 2.71% |
| IJR | iShares Core S&P Small-Cap ETF | iShares Core S&P Small-Cap ETF is an exchange-traded fund incorporated in t... | $84,951 | 1.97% |
| GWX | SPDR S&P International Small C | SPDR S&P International Small Cap ETF is an exchange-traded fund incorporate... | $774 | 2.22% |
| EEM | iShares MSCI Emerging Markets | iShares MSCI Emerging Markets ETF is an exchange-traded fund incorporated i... | $20,902 | 2.14% |
| IYR | iShares U.S. Real Estate ETF | iShares U.S. Real Estate ETF is an exchange-traded fund incorporated in the... | $3,805 | 2.39% |
| TLT | iShares 20+ Year Treasury Bond | iShares 20+ Year Treasury Bond ETF is an exchange-traded fund incorporated ... | $50,014 | 4.34% |
| TIP | iShares TIPS Bond ETF | iShares TIPS ETF is an exchange-traded fund incorporated in the USA. The ET... | $14,350 | 3.15% |
| BWX | SPDR Bloomberg International T | SPDR Bloomberg International Treasury Bond ETF is an exchange-traded fund i... | $1,332 | 2.05% |
| EMB | iShares J.P. Morgan USD Emergi | iShares J.P. Morgan USD Emerging Markets Bond ETF is an exchange-traded fun... | $15,087 | 5.31% |
| GLD | SPDR Gold Shares | SPDR Gold Shares is an investment fund incorporated in the USA. The invest... | $141,430 | |
| DBC | Invesco DB Commodity Index Tra | Invesco DB Commodity Index Tracking Fund is an exchange traded fund incorpo... | $1,298 | 4.84% |
| FXE | Invesco CurrencyShares Euro Cu | Invesco CurrencyShares Euro Trust is an exchange-traded fund incorporated i... | $430 | 1.02% |
| MXWD | MSCI ACWI Index | The MSCI ACWI Index is a free-float weighted equity index. It was developed... | 1.68% | |
| LBUSTRUU | Bloomberg US Agg Total Return | The Bloomberg USAgg Index is a broad-based flagship benchmark that measures... | ||
| USGG3M | US Generic Govt 3 Mth |
1. Benchmarks#
Construct what we will call the GBI (GMWAX Benchmark Index). The GBI is constructed as (per detailed in the info tab)
65% of
MXWD35% of
LBUSTRUU
Calculate excess returns of GMWAX, GBI and of SPY.
For all three, estimate the full-sample (annualized)
mean
vol
Sharpe
Also report
minimum return
5th percentile
maximum drawdown
Also report the correlation matrix.
Solution
# Output from previous execution
| Mean | Vol | Sharpe | Min | Max | 5th Percentile | Max Drawdown | |
|---|---|---|---|---|---|---|---|
| GMWAX | 4.9% | 10.4% | 46.7% | -10.5% | 7.6% | -2.2% | -31.7% |
| SPY | 9.0% | 17.7% | 51.1% | -19.8% | 13.3% | -3.7% | -59.8% |
| GBI | 5.3% | 11.0% | 48.0% | -13.7% | 8.5% | -2.2% | -40.9% |
# Output from previous execution
2. Attribution#
Estimate an attribution LFD of GMWAX on
SPYGBI
That is, estimate a univariate regression for each.
Report the
alpha (annualized)
beta
r-squared
Solution
# Output from previous execution
| alpha | SPY | GBI | r-squared | Treynor Ratio | Info Ratio | |
|---|---|---|---|---|---|---|
| GMWAX | 0.8% | 45.5% | 60.5% | 10.7% | 12.4% | |
| GMWAX | 0.5% | 81.3% | 74.4% | 6.0% | 9.6% |
3. Interpretation#
What do you conclude about GMWAX relative performance?
Is it low-beta to the market?
Does it track the index?
Does
GMWAXseem to earn alpha for its investors?
Solution
3. Other GMO Funds#
1.#
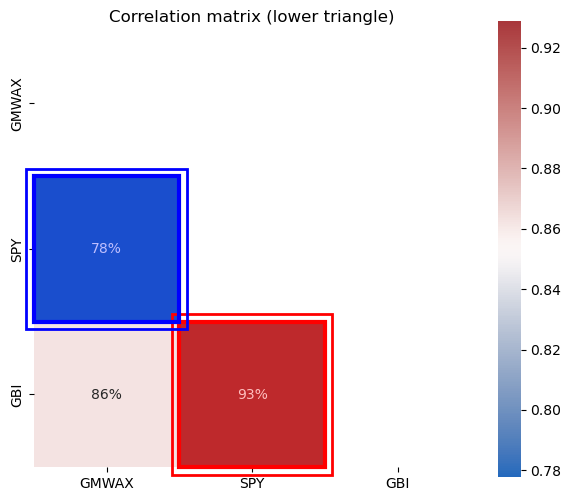
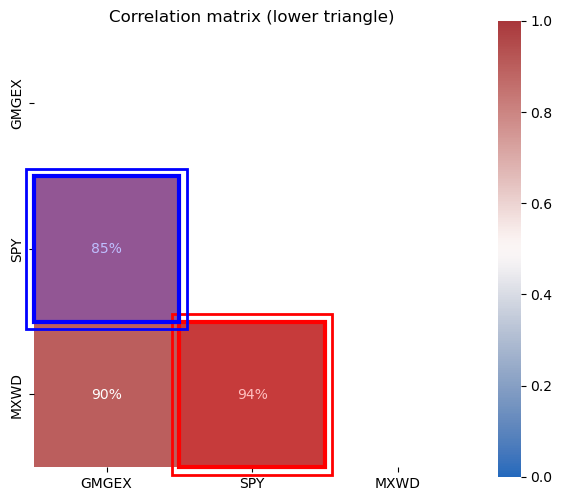
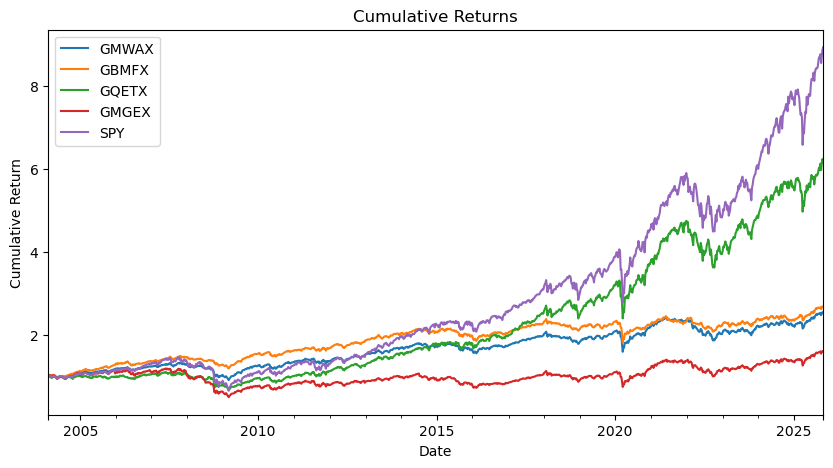
Report the correlation matrix of all GMO funds, along with SPY and the provided indexes.
Plot their cumulative returns.
Solution
2.#
Re-do the analysis of Section 2 for all GMO funds.
Footnote#
No need to compare to the GBI, as it is not provided as a benchmark for the others. You could benchmark GMGEX to MXWD, as it is listed as the primary benchmark. The others don’t list a benchmark.
Solution
# Output from previous execution
| Mean | Vol | Sharpe | Min | Max | 5th Percentile | Max Drawdown | |
|---|---|---|---|---|---|---|---|
| 0 | 2.9% | 15.7% | 18.6% | -16.5% | 10.5% | -3.5% | -58.3% |
# Output from previous execution
| Mean | Vol | Sharpe | Min | Max | 5th Percentile | Max Drawdown | |
|---|---|---|---|---|---|---|---|
| GMGEX | 2.9% | 15.7% | 18.6% | -16.5% | 10.5% | -3.5% | -58.3% |
| SPY | 9.0% | 17.7% | 51.1% | -19.8% | 13.3% | -3.7% | -59.8% |
| MXWD | 7.1% | 16.7% | 42.4% | -20.0% | 12.4% | -3.4% | -58.0% |
# Output from previous execution
(<Figure size 600x600 with 2 Axes>,
 <Axes: title={'center': 'Correlation matrix (lower triangle)'}>)
# Output from previous execution
| alpha | SPY | r-squared | Treynor Ratio | Info Ratio | MXWD | |
|---|---|---|---|---|---|---|
| GMGEX | -3.5% | 74.4% | 71.6% | 3.9% | -42.3% | |
| GMGEX | -3.0% | 81.1% | 3.5% | -43.3% | 83.7% |
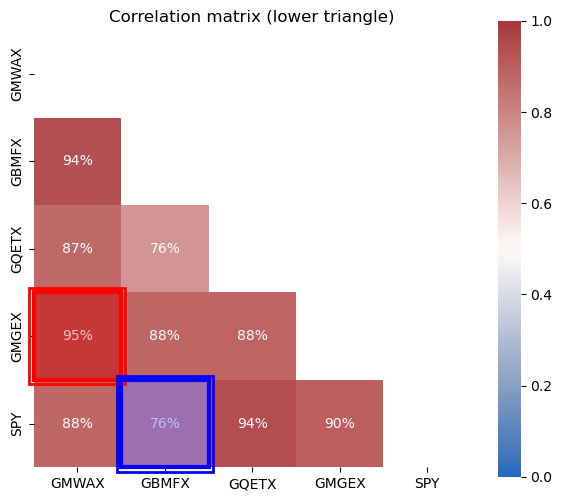
3. Comparing the GMO Funds#
How similar are the GMO funds?
Which do you think is the most attractive investment product?
# Output from previous execution
| Mean | Vol | Sharpe | Min | Max | |
|---|---|---|---|---|---|
| GMWAX | 4.7% | 9.8% | 48.7% | -10.5% | 7.6% |
| GBMFX | 4.8% | 7.9% | 61.3% | -9.6% | 6.8% |
| GQETX | 9.5% | 14.8% | 63.8% | -17.1% | 11.8% |
| GMGEX | 3.5% | 16.3% | 21.5% | -16.5% | 10.5% |
| SPY | 11.6% | 17.4% | 66.5% | -19.8% | 13.3% |
# Output from previous execution
# Output from previous execution
(<Figure size 600x600 with 2 Axes>,
 <Axes: title={'center': 'Correlation matrix (lower triangle)'}>)
4. GMO Across Subsamples#
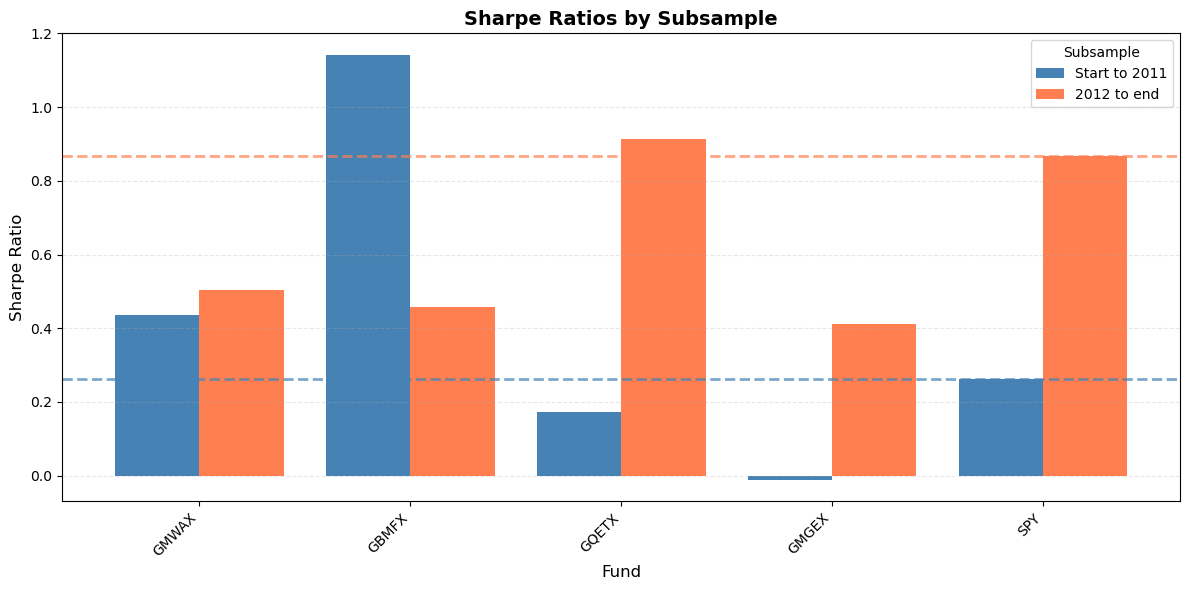
1. Subsamples#
For all the GMO funds as well as SPY, calculate the Sharpe ratio for the following subsamples.
start to 2011
2012 to end
Do we see outperformance in GMO funds across either subsumple? Both?
Solution
# Output from previous execution
Start to 2011
| Mean | Vol | Sharpe | Min | Max | 5th Percentile | Max Drawdown | |
|---|---|---|---|---|---|---|---|
| GMWAX | 4.8% | 11.0% | 43.7% | -8.7% | 6.5% | -2.4% | -31.7% |
| GBMFX | 8.8% | 7.7% | 114.3% | -3.9% | 3.3% | -1.7% | -20.4% |
| GQETX | 2.6% | 15.1% | 17.3% | -17.1% | 7.6% | -3.3% | -40.6% |
| GMGEX | -0.2% | 16.0% | -1.1% | -16.5% | 10.5% | -3.7% | -58.3% |
| SPY | 5.1% | 19.2% | 26.3% | -19.8% | 13.3% | -4.2% | -59.8% |
2012 to end
| Mean | Vol | Sharpe | Min | Max | 5th Percentile | Max Drawdown | |
|---|---|---|---|---|---|---|---|
| GMWAX | 4.9% | 9.8% | 50.5% | -10.5% | 7.6% | -2.0% | -24.5% |
| GBMFX | 3.7% | 8.0% | 45.9% | -9.6% | 6.8% | -1.6% | -23.9% |
| GQETX | 13.4% | 14.6% | 91.3% | -13.0% | 11.8% | -2.8% | -27.6% |
| GMGEX | 6.3% | 15.3% | 41.2% | -13.7% | 10.3% | -3.4% | -34.3% |
| SPY | 13.7% | 15.8% | 86.7% | -14.5% | 12.1% | -3.1% | -31.9% |
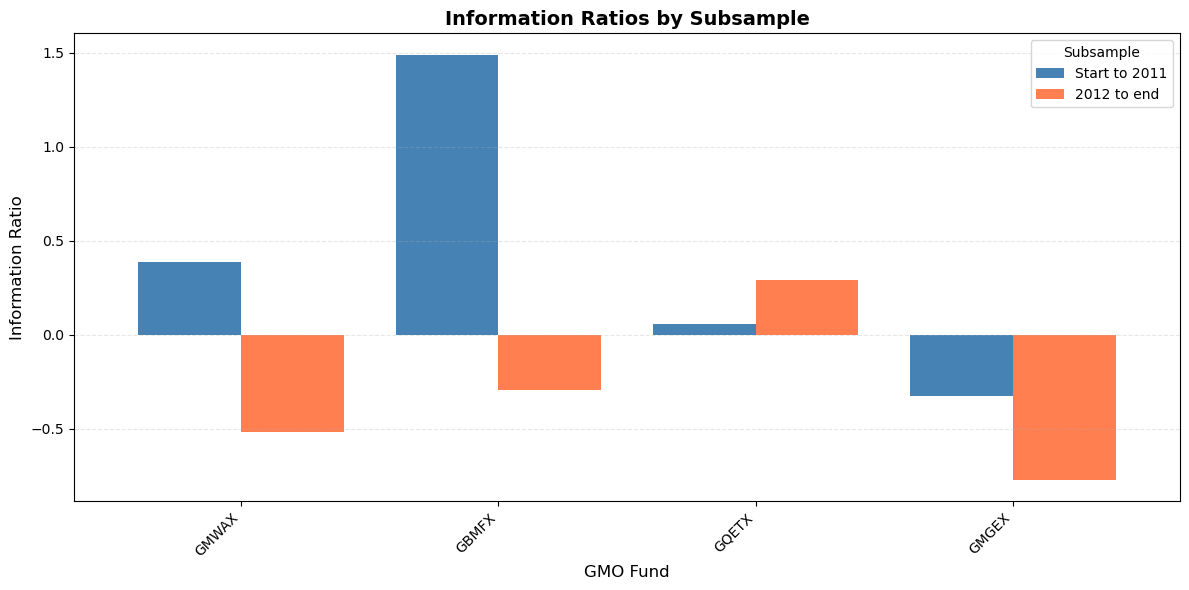
2. Subsample Info Ratios#
For all the GMO funds calculate the Info ratio relative to SPY for the following subsamples.
start to 2011
2012 to end
Do we see outperformance in GMO funds across either subsumple? Both?
Solution
# Output from previous execution
Start to 2011
| alpha | SPY | r-squared | Treynor Ratio | Info Ratio | |
|---|---|---|---|---|---|
| GMWAX | 2.9% | 40.4% | 51.5% | 11.9% | 38.5% |
| GBMFX | 7.3% | 30.1% | 58.7% | 29.1% | 149.1% |
| GQETX | 0.3% | 70.1% | 86.3% | 3.7% | 5.8% |
| GMGEX | -3.0% | 67.4% | 67.6% | -0.3% | -32.4% |
2012 to end
| alpha | SPY | r-squared | Treynor Ratio | Info Ratio | |
|---|---|---|---|---|---|
| GMWAX | -2.5% | 54.1% | 76.2% | 9.1% | -51.7% |
| GBMFX | -1.6% | 38.5% | 56.8% | 9.6% | -29.6% |
| GQETX | 1.1% | 89.4% | 92.7% | 14.9% | 28.9% |
| GMGEX | -5.5% | 86.2% | 78.7% | 7.3% | -77.3% |
3.#
Compare the cumulative returns from 2001 to 2010 of
the GMO funds
SPYTreasuries via
TLTthe risk-free rate for the time period
Is the GMO case correct that equities underperformed this period?
Solution
# Output from previous execution
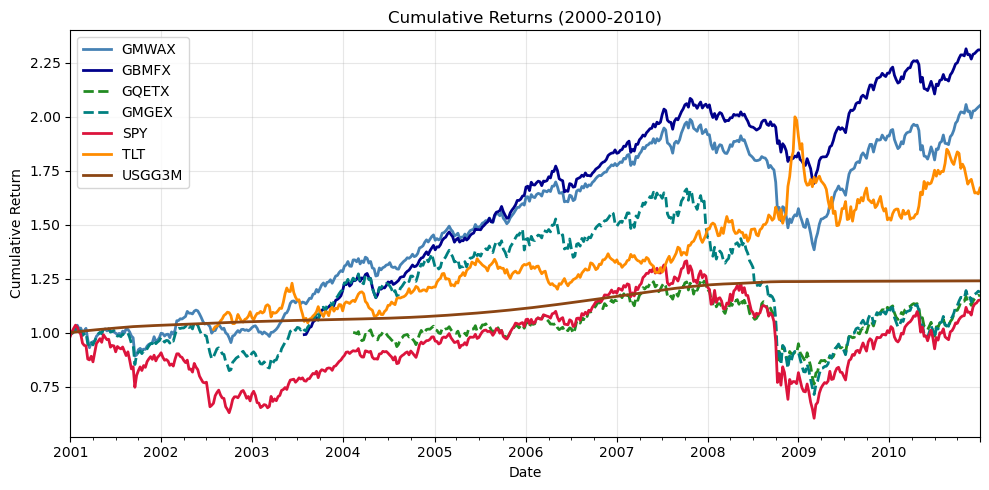
Observations
Yes, we see
SPYand the two equity-focused GMO strategies underperform the risk-free rate!Additionally, they vastly underperform Treasury bonds (
TLT).The multi-asset GMO funds shine in this period, as seen in
GMWAXandGBMFX.
This would be even more pronounced if we started in the year 2000.
5. Factor Exposures#
1.#
Estimate a LFD of GMWAX on the following…
SPYEFAEEMTLTTIP
(GMO case considers additional benchmarks such as foreign bonds, small stocks, etc. They don’t add much to this analysis.)
Report the
alpha
beta
r-squared
2.#
How well do these factors explain GMWAX?
Is there evidence of outperformance?
3.#
Try the multivariate regression on GBMFX, the largest GMO fund.
Solution
# Output from previous execution
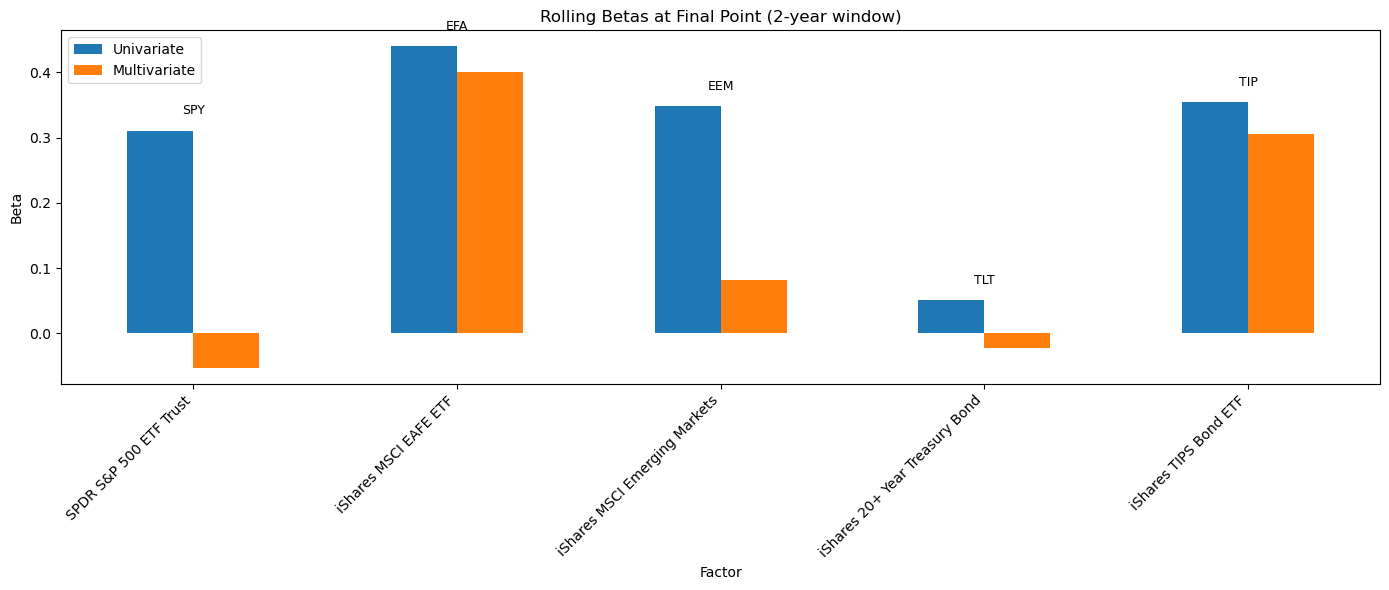
| alpha | SPY | EFA | EEM | TLT | TIP | r-squared | Info Ratio | |
|---|---|---|---|---|---|---|---|---|
| GMWAX | 0.7% | 15.6% | 28.5% | 6.5% | 2.5% | 9.1% | 88.9% | 21.9% |
| GBMFX | 2.2% | 4.7% | 20.2% | 9.5% | -1.4% | 10.1% | 71.6% | 53.0% |
The factors explain most the variation of both funds.
GMWAXhas a small alpha and info ratio, though mostly explained by the factors.GBMFXhas more substantial alpha, is not as well explained by the factors, and a substantial info ratio.
4.#
Consider either GMWAX or GBMFX for the the next subsections.
Estimate the LFD betas on a rolling basis.
use a window of
2years.
Make a bar chart of the betas at the final point in time.
Solution
In addition to the multivariate LFD betas, we also report the univariate beta for each univariate regression.
# Output from previous execution
5.#
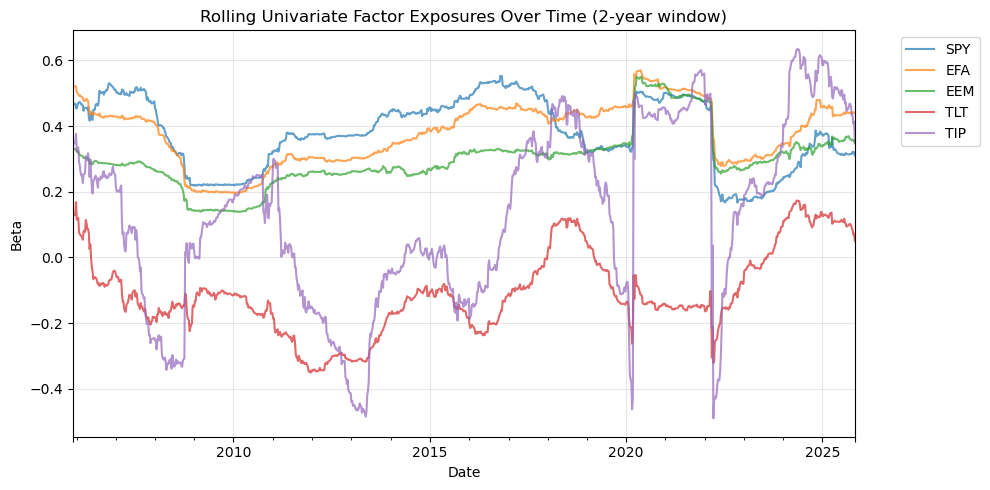
Plot the exposures and discuss how the strategy has changed over time.
Solution
# Output from previous execution
# Output from previous execution

6. Forecasts#
The chapter 7 exercise on forecasting SPY takes readers through forecast regressions using valuation signals similar to those used by GMO.
1.#
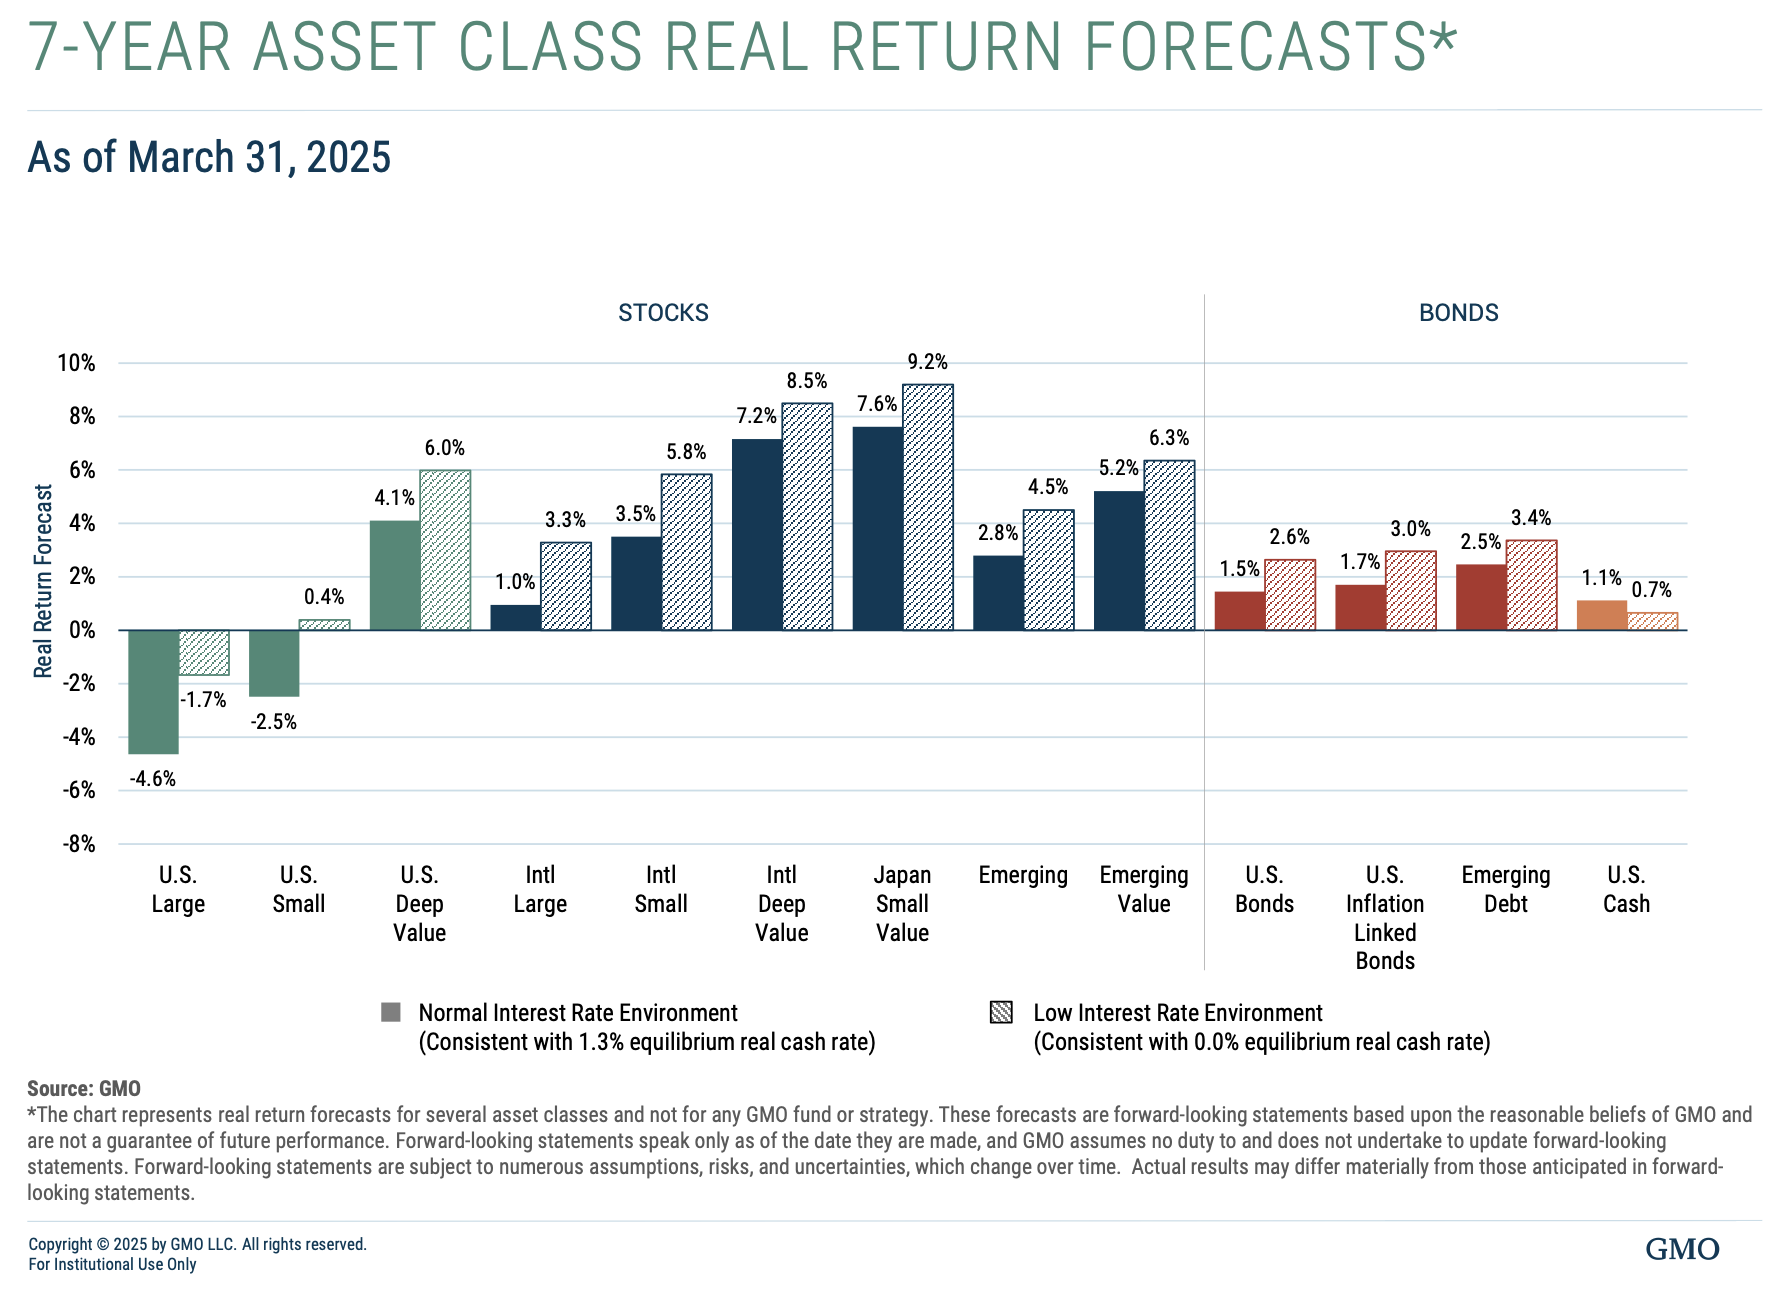
In July 2015, GMO forecasted the following as 7-year annualized mean real returns.
Footnote:#
Their forecasts specify classes and benchmarks. Here, we map those to specific ETFs not specified by GMO. Additionally, we do not track every forecast made.
# Output from previous execution
| forecast | |
|---|---|
| SPY | -2.0% |
| EFA | -0.5% |
| EEM | -3.2% |
| TLT | -0.9% |
| TIP | 0.0% |
| IJR | -2.0% |
| GWX | -1.1% |
| EMB | 2.1% |
| BWX | -2.8% |
Use the benchmarks data to calculate the realized 7-year nominal excess return on these assets. You have ETF proxies for most of the categories, and ignore those for which you do not.
Note#
Using nominal excess instead of real total should not greatly impact the analysis.
Solution
# Output from previous execution
| forecast | actual | |
|---|---|---|
| SPY | -2.0% | 14.2% |
| EFA | -0.5% | 6.8% |
| EEM | -3.2% | 6.3% |
| TLT | -0.9% | 4.8% |
| TIP | 0.0% | 3.4% |
| IJR | -2.0% | 13.1% |
| GWX | -1.1% | 8.6% |
| EMB | 2.1% | 4.0% |
| BWX | -2.8% | 0.5% |
# Output from previous execution
Text(0.5, 0, '')

2.#
Given your out-of-sample results from the forecasting exercise, are you surprised by GMO’s forecast accuracy?
Could a dynamic strategy based on these signals have avoided the 2000–2011 equity underperformance?
How does the in-sample vs. out-of-sample distinction relate to GMO’s reliance on long-run mean reversion?
Solution
Not surprising. The OOS \(R^2\) from the exercises was negative, meaning the regressions couldn’t even beat the expanding mean. GMO’s forecasts being off is exactly what you’d expect.
Probably not. The OOS strategy had worse drawdowns and higher vol than the in-sample version. If anything, trading on these signals in real time adds risk rather than reducing it.
Mean reversion is the in-sample story: over the full sample, valuation ratios do predict returns. But the OOS results show this breaks down in real time—parameter estimates shift, and the predictability doesn’t survive point-in-time estimation. GMO is essentially betting on an in-sample relationship holding going forward.
Addendum#
GMO publishes their quarterly forecasts, available with a free registration on their site.