Solution - Forecasting SPY#
# Output from previous execution
| DP | EP | CAPE | BP | T10YR | CREDIT | VIX | TSPREAD | |
|---|---|---|---|---|---|---|---|---|
| date | ||||||||
| 1993-02-28 00:00:00 | 2.8 | 4.1 | 15.8 | 42.6 | 6.0 | 221.0 | 13.2 | 3.0 |
| 1993-03-31 00:00:00 | 2.8 | 4.7 | 16.0 | 35.2 | 6.0 | 218.6 | 12.5 | 3.1 |
| 1993-04-30 00:00:00 | 2.9 | 4.0 | 15.6 | 39.2 | 6.0 | 216.1 | 12.4 | 3.1 |
| 1993-05-31 00:00:00 | 2.8 | 3.2 | 16.3 | 38.7 | 6.1 | 211.1 | 13.5 | 3.0 |
| 1993-06-30 00:00:00 | 2.8 | 3.1 | 16.2 | 38.7 | 5.8 | 218.4 | 11.3 | 2.7 |
| 1993-07-31 00:00:00 | 2.8 | 3.2 | 16.0 | 38.9 | 5.8 | 210.3 | 11.7 | 2.7 |
| 1993-08-31 00:00:00 | 2.7 | 2.7 | 16.7 | 37.8 | 5.4 | 191.2 | 11.8 | 2.4 |
| 1993-09-30 00:00:00 | 2.8 | 2.7 | 16.2 | 38.1 | 5.4 | 201.8 | 13.0 | 2.4 |
| 1993-10-31 00:00:00 | 2.7 | 2.7 | 16.7 | 37.5 | 5.4 | 196.3 | 11.5 | 2.3 |
| 1993-11-30 00:00:00 | 2.7 | 3.1 | 16.9 | 38.8 | 5.8 | 192.1 | 13.8 | 2.6 |
| 1993-12-31 00:00:00 | 2.7 | 3.1 | 17.1 | 38.4 | 5.8 | 197.6 | 11.7 | 2.7 |
| 1994-01-31 00:00:00 | 2.6 | 2.9 | 16.3 | 37.1 | 5.6 | 190.8 | 10.6 | 2.6 |
| 1994-02-28 00:00:00 | 2.7 | 3.1 | 15.8 | 38.4 | 6.1 | 179.1 | 14.9 | 2.7 |
| 1994-03-31 00:00:00 | 2.9 | 3.2 | 15.2 | 40.2 | 6.7 | 162.2 | 20.4 | 3.2 |
| 1994-04-30 00:00:00 | 2.8 | 4.8 | 15.3 | 40.2 | 7.0 | 149.8 | 13.8 | 3.1 |
| 1994-05-31 00:00:00 | 2.8 | 4.9 | 15.5 | 40.1 | 7.1 | 153.3 | 13.0 | 2.9 |
| 1994-06-30 00:00:00 | 2.8 | 5.1 | 15.3 | 41.2 | 7.3 | 154.0 | 15.0 | 3.1 |
| 1994-07-31 00:00:00 | 2.8 | 4.9 | 15.7 | 40.0 | 7.1 | 149.9 | 11.1 | 2.8 |
| 1994-08-31 00:00:00 | 2.7 | 5.5 | 16.3 | 39.1 | 7.2 | 156.7 | 12.0 | 2.5 |
| 1994-09-30 00:00:00 | 2.8 | 5.6 | 15.8 | 40.1 | 7.6 | 151.7 | 14.3 | 2.8 |
| 1994-10-31 00:00:00 | 2.7 | 5.4 | 16.1 | 39.3 | 7.8 | 140.3 | 14.6 | 2.7 |
| 1994-11-30 00:00:00 | 2.8 | 6.1 | 15.6 | 41.9 | 7.9 | 130.4 | 15.9 | 2.2 |
| 1994-12-31 00:00:00 | 2.8 | 6.0 | 15.8 | 41.4 | 7.8 | 131.8 | 13.2 | 2.1 |
| 1995-01-31 00:00:00 | 2.8 | 6.0 | 15.4 | 40.5 | 7.6 | 134.9 | 12.0 | 1.6 |
| 1995-02-28 00:00:00 | 2.7 | 5.7 | 15.9 | 39.1 | 7.2 | 154.9 | 11.8 | 1.3 |
| 1995-03-31 00:00:00 | 2.6 | 6.0 | 16.4 | 35.9 | 7.2 | 149.4 | 13.4 | 1.3 |
| 1995-04-30 00:00:00 | 2.5 | 6.5 | 16.9 | 39.0 | 7.1 | 152.5 | 11.8 | 1.2 |
| 1995-05-31 00:00:00 | 2.5 | 6.2 | 17.4 | 37.9 | 6.3 | 167.6 | 12.8 | 0.5 |
| 1995-06-30 00:00:00 | 2.4 | 6.1 | 17.8 | 37.1 | 6.2 | 174.7 | 11.4 | 0.6 |
| 1995-07-31 00:00:00 | 2.4 | 5.9 | 18.3 | 35.8 | 6.4 | 174.4 | 13.5 | 0.8 |
| 1995-08-31 00:00:00 | 2.4 | 6.3 | 18.2 | 37.3 | 6.3 | 172.6 | 11.5 | 0.8 |
| 1995-09-30 00:00:00 | 2.3 | 6.0 | 18.9 | 35.7 | 6.2 | 169.8 | 12.7 | 0.8 |
| 1995-10-31 00:00:00 | 2.3 | 6.0 | 18.9 | 35.8 | 6.0 | 171.0 | 13.8 | 0.5 |
| 1995-11-30 00:00:00 | 2.3 | 5.8 | 19.6 | 35.1 | 5.7 | 182.9 | 11.6 | 0.3 |
| 1995-12-31 00:00:00 | 2.2 | 5.7 | 19.9 | 34.6 | 5.6 | 180.8 | 12.5 | 0.5 |
| 1996-01-31 00:00:00 | 2.2 | 5.5 | 19.6 | 33.4 | 5.6 | 184.0 | 12.5 | 0.5 |
| 1996-02-29 00:00:00 | 2.2 | 5.5 | 19.7 | 33.2 | 6.1 | 181.2 | 17.0 | 1.1 |
| 1996-03-31 00:00:00 | 2.2 | 5.3 | 20.0 | 32.7 | 6.3 | 179.3 | 18.9 | 1.2 |
| 1996-04-30 00:00:00 | 2.2 | 5.3 | 20.3 | 32.6 | 6.7 | 160.0 | 15.8 | 1.5 |
| 1996-05-31 00:00:00 | 2.1 | 5.1 | 20.8 | 32.8 | 6.9 | 147.8 | 16.1 | 1.7 |
| 1996-06-30 00:00:00 | 2.1 | 5.1 | 20.9 | 32.7 | 6.7 | 152.9 | 13.7 | 1.6 |
| 1996-07-31 00:00:00 | 2.2 | 5.4 | 19.9 | 34.2 | 6.8 | 150.6 | 19.5 | 1.5 |
| 1996-08-31 00:00:00 | 2.2 | 5.6 | 20.4 | 34.8 | 6.9 | 149.7 | 17.0 | 1.7 |
| 1996-09-30 00:00:00 | 2.1 | 5.3 | 21.6 | 32.8 | 6.7 | 151.7 | 16.9 | 1.7 |
| 1996-10-31 00:00:00 | 2.1 | 5.1 | 22.5 | 31.9 | 6.3 | 157.1 | 18.1 | 1.2 |
| 1996-11-30 00:00:00 | 1.9 | 5.1 | 24.0 | 30.4 | 6.0 | 164.9 | 17.1 | 0.9 |
| 1996-12-31 00:00:00 | 2.0 | 5.2 | 23.3 | 31.0 | 6.4 | 155.2 | 20.9 | 1.2 |
| 1997-01-31 00:00:00 | 1.8 | 4.9 | 23.2 | 29.2 | 6.5 | 153.6 | 19.5 | 1.3 |
| 1997-02-28 00:00:00 | 1.9 | 4.8 | 23.2 | 29.0 | 6.6 | 149.8 | 21.1 | 1.3 |
| 1997-03-31 00:00:00 | 1.9 | 5.6 | 22.2 | 31.9 | 6.9 | 141.7 | 22.1 | 1.6 |
| 1997-04-30 00:00:00 | 1.8 | 5.2 | 23.6 | 30.3 | 6.7 | 150.2 | 20.1 | 1.5 |
| 1997-05-31 00:00:00 | 1.8 | 6.5 | 25.0 | 28.6 | 6.7 | 152.1 | 19.2 | 1.7 |
| 1997-06-30 00:00:00 | 1.7 | 9.4 | 25.8 | 27.5 | 6.5 | 151.0 | 21.5 | 1.3 |
| 1997-07-31 00:00:00 | 1.6 | 8.7 | 27.7 | 25.4 | 6.0 | 154.9 | 21.5 | 0.8 |
| 1997-08-31 00:00:00 | 1.7 | 9.1 | 26.1 | 27.8 | 6.3 | 144.1 | 24.8 | 1.1 |
| 1997-09-30 00:00:00 | 1.6 | 8.5 | 27.4 | 26.5 | 6.1 | 155.7 | 22.9 | 1.0 |
| 1997-10-31 00:00:00 | 1.7 | 8.8 | 26.4 | 27.4 | 5.8 | 160.9 | 35.1 | 0.6 |
| 1997-11-30 00:00:00 | 1.6 | 10.1 | 27.6 | 27.0 | 5.9 | 150.6 | 27.4 | 0.7 |
| 1997-12-31 00:00:00 | 1.6 | 9.9 | 27.8 | 26.5 | 5.7 | 153.8 | 24.0 | 0.4 |
| 1998-01-31 00:00:00 | 1.6 | 9.7 | 26.6 | 26.2 | 5.5 | 170.5 | 21.5 | 0.3 |
| 1998-02-28 00:00:00 | 1.5 | 9.1 | 28.3 | 24.4 | 5.6 | 166.8 | 18.6 | 0.3 |
| 1998-03-31 00:00:00 | 1.4 | 4.9 | 29.7 | 24.0 | 5.7 | 168.6 | 24.2 | 0.5 |
| 1998-04-30 00:00:00 | 1.4 | 4.9 | 30.1 | 23.8 | 5.7 | 166.9 | 21.2 | 0.7 |
| 1998-05-31 00:00:00 | 1.4 | 6.5 | 29.7 | 24.0 | 5.6 | 163.8 | 21.3 | 0.5 |
| 1998-06-30 00:00:00 | 1.4 | 6.2 | 30.8 | 23.1 | 5.4 | 166.4 | 19.7 | 0.4 |
| 1998-07-31 00:00:00 | 1.4 | 6.3 | 30.0 | 23.3 | 5.5 | 171.6 | 24.8 | 0.4 |
| 1998-08-31 00:00:00 | 1.6 | 4.8 | 26.0 | 28.1 | 5.0 | 213.4 | 44.3 | 0.2 |
| 1998-09-30 00:00:00 | 1.6 | 4.5 | 27.6 | 26.3 | 4.4 | 259.0 | 41.0 | 0.1 |
| 1998-10-31 00:00:00 | 1.4 | 4.2 | 29.9 | 24.3 | 4.6 | 268.5 | 28.1 | 0.3 |
| 1998-11-30 00:00:00 | 1.4 | 3.9 | 31.7 | 24.1 | 4.7 | 247.6 | 26.0 | 0.2 |
| 1998-12-31 00:00:00 | 1.3 | 3.7 | 33.5 | 22.8 | 4.6 | 258.2 | 24.4 | 0.2 |
| 1999-01-31 00:00:00 | 1.2 | 3.5 | 32.8 | 21.9 | 4.7 | 255.9 | 26.2 | 0.2 |
| 1999-02-28 00:00:00 | 1.3 | 3.6 | 31.5 | 22.4 | 5.3 | 224.3 | 27.9 | 0.6 |
| 1999-03-31 00:00:00 | 1.2 | 3.6 | 32.3 | 22.1 | 5.2 | 231.8 | 23.3 | 0.8 |
| 1999-04-30 00:00:00 | 1.2 | 3.5 | 33.0 | 21.0 | 5.3 | 223.2 | 25.1 | 0.8 |
| 1999-05-31 00:00:00 | 1.2 | 3.7 | 32.3 | 22.7 | 5.6 | 220.0 | 25.4 | 1.0 |
| 1999-06-30 00:00:00 | 1.2 | 3.5 | 33.9 | 21.6 | 5.8 | 221.0 | 21.1 | 1.0 |
| 1999-07-31 00:00:00 | 1.2 | 3.6 | 33.0 | 22.2 | 5.9 | 220.7 | 24.6 | 1.2 |
| 1999-08-31 00:00:00 | 1.2 | 3.8 | 33.0 | 22.6 | 6.0 | 224.0 | 24.4 | 1.0 |
| 1999-09-30 00:00:00 | 1.3 | 3.9 | 31.9 | 23.2 | 5.9 | 232.3 | 25.4 | 1.0 |
| 1999-10-31 00:00:00 | 1.2 | 3.6 | 33.5 | 21.8 | 6.0 | 227.6 | 22.2 | 0.9 |
| 1999-11-30 00:00:00 | 1.2 | 3.7 | 34.3 | 22.1 | 6.2 | 197.9 | 24.2 | 0.9 |
| 1999-12-31 00:00:00 | 1.1 | 3.5 | 36.5 | 20.8 | 6.4 | 173.8 | 24.6 | 1.1 |
| 2000-01-31 00:00:00 | 1.2 | 3.7 | 32.7 | 21.9 | 6.7 | 169.5 | 24.9 | 1.0 |
| 2000-02-29 00:00:00 | 1.2 | 4.0 | 31.9 | 21.9 | 6.4 | 192.1 | 23.4 | 0.6 |
| 2000-03-31 00:00:00 | 1.1 | 3.8 | 35.3 | 21.9 | 6.0 | 232.6 | 24.1 | 0.1 |
| 2000-04-30 00:00:00 | 1.1 | 3.9 | 34.7 | 22.5 | 6.2 | 235.8 | 26.2 | 0.4 |
| 2000-05-31 00:00:00 | 1.1 | 4.3 | 33.9 | 23.7 | 6.3 | 253.8 | 23.6 | 0.7 |
| 2000-06-30 00:00:00 | 1.1 | 4.2 | 35.0 | 23.2 | 6.0 | 239.9 | 19.5 | 0.2 |
| 2000-07-31 00:00:00 | 1.1 | 4.2 | 35.1 | 23.5 | 6.0 | 227.9 | 20.7 | -0.2 |
| 2000-08-31 00:00:00 | 1.1 | 4.1 | 36.9 | 22.5 | 5.7 | 251.5 | 16.8 | -0.6 |
| 2000-09-30 00:00:00 | 1.1 | 4.2 | 35.3 | 23.4 | 5.8 | 253.8 | 20.6 | -0.4 |
| 2000-10-31 00:00:00 | 1.1 | 4.2 | 35.5 | 23.5 | 5.8 | 257.9 | 23.6 | -0.6 |
| 2000-11-30 00:00:00 | 1.2 | 4.6 | 33.0 | 25.7 | 5.5 | 265.2 | 29.6 | -0.7 |
| 2000-12-31 00:00:00 | 1.2 | 4.6 | 33.2 | 25.7 | 5.1 | 288.8 | 26.9 | -0.8 |
| 2001-01-31 00:00:00 | 1.2 | 4.5 | 31.1 | 24.7 | 5.1 | 269.6 | 22.0 | 0.1 |
| 2001-02-28 00:00:00 | 1.3 | 4.5 | 28.5 | 27.0 | 4.9 | 290.4 | 28.4 | 0.0 |
| 2001-03-31 00:00:00 | 1.4 | 4.9 | 26.8 | 28.5 | 4.9 | 305.3 | 28.6 | 0.6 |
| 2001-04-30 00:00:00 | 1.3 | 4.6 | 28.8 | 26.8 | 5.3 | 274.2 | 25.5 | 1.5 |
| 2001-05-31 00:00:00 | 1.2 | 4.2 | 29.0 | 27.9 | 5.4 | 269.9 | 22.6 | 1.8 |
| 2001-06-30 00:00:00 | 1.3 | 4.3 | 28.2 | 28.7 | 5.4 | 265.8 | 19.1 | 1.8 |
| 2001-07-31 00:00:00 | 1.3 | 4.4 | 28.2 | 28.9 | 5.1 | 279.6 | 21.6 | 1.5 |
| 2001-08-31 00:00:00 | 1.4 | 4.4 | 26.6 | 31.6 | 4.8 | 291.8 | 24.9 | 1.5 |
| 2001-09-30 00:00:00 | 1.5 | 4.8 | 24.6 | 34.3 | 4.6 | 343.2 | 31.9 | 2.2 |
| 2001-10-31 00:00:00 | 1.5 | 4.7 | 24.3 | 33.6 | 4.2 | 344.8 | 33.6 | 2.2 |
| 2001-11-30 00:00:00 | 1.4 | 4.0 | 26.1 | 30.0 | 4.8 | 312.8 | 23.8 | 3.0 |
| 2001-12-31 00:00:00 | 1.4 | 4.0 | 26.1 | 30.1 | 5.1 | 286.9 | 23.8 | 3.3 |
| 2002-01-31 00:00:00 | 1.4 | 3.9 | 24.0 | 30.6 | 5.0 | 288.7 | 21.1 | 3.3 |
| 2002-02-28 00:00:00 | 1.4 | 4.0 | 23.6 | 31.1 | 4.9 | 298.3 | 21.6 | 3.1 |
| 2002-03-31 00:00:00 | 1.4 | 3.8 | 24.4 | 30.4 | 5.4 | 283.0 | 17.4 | 3.6 |
| 2002-04-30 00:00:00 | 1.4 | 4.1 | 22.9 | 32.6 | 5.1 | 286.5 | 21.9 | 3.3 |
| 2002-05-31 00:00:00 | 1.5 | 3.8 | 22.6 | 32.4 | 5.0 | 301.7 | 20.0 | 3.3 |
| 2002-06-30 00:00:00 | 1.6 | 4.1 | 21.0 | 35.0 | 4.8 | 319.4 | 25.4 | 3.1 |
| 2002-07-31 00:00:00 | 1.7 | 4.4 | 19.6 | 37.8 | 4.5 | 330.1 | 32.0 | 2.8 |
| 2002-08-31 00:00:00 | 1.7 | 4.9 | 19.6 | 37.2 | 4.1 | 331.9 | 32.6 | 2.5 |
| 2002-09-30 00:00:00 | 1.9 | 5.4 | 17.4 | 41.5 | 3.6 | 379.6 | 39.7 | 2.0 |
| 2002-10-31 00:00:00 | 1.8 | 5.0 | 18.8 | 38.9 | 3.9 | 385.8 | 31.1 | 2.4 |
| 2002-11-30 00:00:00 | 1.7 | 5.0 | 20.4 | 36.2 | 4.2 | 339.5 | 27.5 | 3.0 |
| 2002-12-31 00:00:00 | 1.8 | 5.1 | 19.1 | 38.8 | 3.8 | 349.4 | 28.6 | 2.6 |
| 2003-01-31 00:00:00 | 1.8 | 5.3 | 17.6 | 39.9 | 4.0 | 319.8 | 31.2 | 2.8 |
| 2003-02-28 00:00:00 | 1.9 | 5.2 | 17.2 | 40.6 | 3.7 | 323.0 | 29.6 | 2.5 |
| 2003-03-31 00:00:00 | 1.9 | 6.9 | 17.4 | 39.7 | 3.8 | 307.4 | 29.1 | 2.7 |
| 2003-04-30 00:00:00 | 1.8 | 6.3 | 18.7 | 36.0 | 3.8 | 281.4 | 21.2 | 2.7 |
| 2003-05-31 00:00:00 | 1.7 | 4.7 | 19.6 | 35.4 | 3.4 | 285.0 | 19.5 | 2.3 |
| 2003-06-30 00:00:00 | 1.7 | 4.7 | 19.8 | 35.0 | 3.5 | 283.7 | 19.5 | 2.7 |
| 2003-07-31 00:00:00 | 1.7 | 4.6 | 20.0 | 34.2 | 4.4 | 266.4 | 19.5 | 3.5 |
| 2003-08-31 00:00:00 | 1.6 | 4.6 | 20.4 | 35.6 | 4.5 | 244.6 | 18.6 | 3.5 |
| 2003-09-30 00:00:00 | 1.7 | 4.6 | 20.2 | 35.9 | 3.9 | 259.2 | 22.7 | 3.0 |
| 2003-10-31 00:00:00 | 1.6 | 4.3 | 21.2 | 33.9 | 4.3 | 239.7 | 16.1 | 3.3 |
| 2003-11-30 00:00:00 | 1.6 | 4.6 | 21.4 | 34.5 | 4.3 | 233.8 | 16.3 | 3.4 |
| 2003-12-31 00:00:00 | 1.6 | 4.3 | 22.2 | 32.8 | 4.2 | 236.4 | 18.3 | 3.3 |
| 2004-01-31 00:00:00 | 1.5 | 4.6 | 21.2 | 32.2 | 4.1 | 221.8 | 16.6 | 3.2 |
| 2004-02-29 00:00:00 | 1.5 | 5.1 | 21.4 | 31.8 | 4.0 | 222.9 | 14.6 | 3.0 |
| 2004-03-31 00:00:00 | 1.6 | 5.1 | 21.0 | 33.4 | 3.8 | 231.5 | 16.7 | 2.9 |
| 2004-04-30 00:00:00 | 1.6 | 5.2 | 20.6 | 34.0 | 4.5 | 207.5 | 17.2 | 3.5 |
| 2004-05-31 00:00:00 | 1.6 | 5.4 | 20.9 | 34.6 | 4.6 | 204.3 | 15.5 | 3.6 |
| 2004-06-30 00:00:00 | 1.6 | 5.3 | 21.2 | 33.9 | 4.6 | 212.9 | 14.3 | 3.3 |
| 2004-07-31 00:00:00 | 1.7 | 5.5 | 20.4 | 35.1 | 4.5 | 212.5 | 15.3 | 3.0 |
| 2004-08-31 00:00:00 | 1.7 | 5.8 | 20.4 | 36.2 | 4.1 | 220.3 | 15.3 | 2.5 |
| 2004-09-30 00:00:00 | 1.7 | 5.7 | 20.6 | 35.9 | 4.1 | 213.1 | 13.3 | 2.4 |
| 2004-10-31 00:00:00 | 1.7 | 5.6 | 20.8 | 35.3 | 4.0 | 211.7 | 16.3 | 2.1 |
| 2004-11-30 00:00:00 | 2.0 | 5.5 | 21.4 | 35.1 | 4.3 | 196.1 | 13.2 | 2.1 |
| 2004-12-31 00:00:00 | 1.9 | 5.4 | 22.0 | 33.9 | 4.2 | 188.2 | 13.3 | 2.0 |
| 2005-01-31 00:00:00 | 2.0 | 5.5 | 19.7 | 34.8 | 4.1 | 176.2 | 12.8 | 1.7 |
| 2005-02-28 00:00:00 | 2.0 | 5.7 | 20.1 | 34.2 | 4.4 | 157.3 | 12.1 | 1.6 |
| 2005-03-31 00:00:00 | 2.0 | 5.7 | 19.6 | 36.3 | 4.5 | 165.8 | 14.0 | 1.7 |
| 2005-04-30 00:00:00 | 2.1 | 5.8 | 19.2 | 37.1 | 4.2 | 177.2 | 15.3 | 1.3 |
| 2005-05-31 00:00:00 | 2.0 | 5.7 | 19.8 | 36.3 | 4.0 | 191.9 | 13.3 | 1.0 |
| 2005-06-30 00:00:00 | 2.1 | 5.7 | 19.7 | 36.3 | 3.9 | 189.7 | 12.0 | 0.8 |
| 2005-07-31 00:00:00 | 2.0 | 5.5 | 20.4 | 35.1 | 4.3 | 167.4 | 11.6 | 0.9 |
| 2005-08-31 00:00:00 | 2.0 | 5.8 | 20.1 | 36.3 | 4.0 | 177.6 | 12.6 | 0.5 |
| 2005-09-30 00:00:00 | 2.0 | 5.7 | 20.1 | 36.0 | 4.3 | 182.6 | 11.9 | 0.8 |
| 2005-10-31 00:00:00 | 2.1 | 5.8 | 19.6 | 36.7 | 4.6 | 184.9 | 15.3 | 0.7 |
| 2005-11-30 00:00:00 | 1.8 | 5.9 | 20.5 | 36.4 | 4.5 | 189.6 | 12.1 | 0.6 |
| 2005-12-31 00:00:00 | 1.8 | 5.9 | 20.3 | 36.5 | 4.4 | 181.9 | 12.1 | 0.3 |
| 2006-01-31 00:00:00 | 1.8 | 5.7 | 19.3 | 35.5 | 4.5 | 179.5 | 12.9 | 0.1 |
| 2006-02-28 00:00:00 | 1.8 | 6.4 | 19.3 | 36.5 | 4.6 | 164.9 | 12.3 | -0.1 |
| 2006-03-31 00:00:00 | 1.8 | 6.2 | 19.5 | 36.5 | 4.8 | 170.3 | 11.4 | 0.2 |
| 2006-04-30 00:00:00 | 1.8 | 6.1 | 19.9 | 36.0 | 5.1 | 168.9 | 11.6 | 0.3 |
| 2006-05-31 00:00:00 | 1.9 | 6.8 | 19.2 | 38.1 | 5.1 | 166.1 | 16.4 | 0.3 |
| 2006-06-30 00:00:00 | 1.9 | 6.5 | 19.3 | 38.1 | 5.1 | 168.4 | 13.1 | 0.2 |
| 2006-07-31 00:00:00 | 1.9 | 6.5 | 19.3 | 37.9 | 5.0 | 169.1 | 14.9 | -0.1 |
| 2006-08-31 00:00:00 | 1.8 | 6.6 | 19.9 | 37.7 | 4.7 | 174.4 | 12.3 | -0.3 |
| 2006-09-30 00:00:00 | 1.8 | 6.5 | 20.4 | 36.8 | 4.6 | 173.2 | 12.0 | -0.2 |
| 2006-10-31 00:00:00 | 1.8 | 6.3 | 20.9 | 35.6 | 4.6 | 165.2 | 11.1 | -0.5 |
| 2006-11-30 00:00:00 | 1.8 | 6.3 | 21.2 | 34.9 | 4.5 | 164.2 | 10.9 | -0.6 |
| 2006-12-31 00:00:00 | 1.8 | 6.2 | 21.4 | 34.5 | 4.7 | 164.8 | 11.6 | -0.3 |
| 2007-01-31 00:00:00 | 1.8 | 6.1 | 20.1 | 34.0 | 4.8 | 159.2 | 10.4 | -0.3 |
| 2007-02-28 00:00:00 | 1.8 | 6.3 | 19.6 | 35.8 | 4.6 | 159.4 | 15.4 | -0.6 |
| 2007-03-31 00:00:00 | 1.8 | 6.3 | 19.8 | 35.3 | 4.6 | 175.6 | 14.6 | -0.4 |
| 2007-04-30 00:00:00 | 1.8 | 6.0 | 20.8 | 33.8 | 4.6 | 168.8 | 14.2 | -0.2 |
| 2007-05-31 00:00:00 | 1.7 | 5.9 | 21.5 | 33.3 | 4.9 | 161.2 | 13.1 | 0.2 |
| 2007-06-30 00:00:00 | 1.8 | 6.0 | 21.1 | 33.9 | 5.0 | 159.6 | 16.2 | 0.2 |
| 2007-07-31 00:00:00 | 1.9 | 6.2 | 20.6 | 34.9 | 4.7 | 189.1 | 23.5 | -0.2 |
| 2007-08-31 00:00:00 | 1.9 | 6.3 | 20.9 | 34.9 | 4.5 | 206.1 | 23.4 | 0.4 |
| 2007-09-30 00:00:00 | 1.8 | 6.1 | 21.6 | 33.7 | 4.6 | 200.3 | 18.0 | 0.8 |
| 2007-10-31 00:00:00 | 1.8 | 6.0 | 21.9 | 33.2 | 4.5 | 199.9 | 18.5 | 0.6 |
| 2007-11-30 00:00:00 | 1.9 | 6.2 | 20.8 | 35.2 | 3.9 | 250.2 | 22.9 | 0.8 |
| 2007-12-31 00:00:00 | 1.9 | 6.3 | 20.5 | 35.5 | 4.0 | 253.7 | 22.5 | 0.8 |
| 2008-01-31 00:00:00 | 2.1 | 6.7 | 18.1 | 37.8 | 3.6 | 303.7 | 26.2 | 1.7 |
| 2008-02-29 00:00:00 | 2.2 | 6.5 | 17.4 | 39.5 | 3.5 | 324.1 | 26.5 | 1.7 |
| 2008-03-31 00:00:00 | 2.2 | 6.6 | 17.6 | 39.7 | 3.4 | 349.0 | 25.6 | 2.1 |
| 2008-04-30 00:00:00 | 2.1 | 6.3 | 18.5 | 37.9 | 3.7 | 314.2 | 20.8 | 2.4 |
| 2008-05-31 00:00:00 | 2.1 | 5.9 | 18.6 | 37.6 | 4.1 | 300.1 | 17.8 | 2.2 |
| 2008-06-30 00:00:00 | 2.3 | 6.5 | 17.0 | 41.2 | 4.0 | 307.1 | 23.9 | 2.2 |
| 2008-07-31 00:00:00 | 2.3 | 6.6 | 16.8 | 41.6 | 3.9 | 326.4 | 22.9 | 2.3 |
| 2008-08-31 00:00:00 | 2.3 | 6.0 | 17.1 | 41.2 | 3.8 | 330.8 | 20.6 | 2.1 |
| 2008-09-30 00:00:00 | 2.5 | 6.6 | 16.4 | 45.3 | 3.8 | 402.7 | 39.4 | 2.9 |
| 2008-10-31 00:00:00 | 3.0 | 8.0 | 13.6 | 54.6 | 4.0 | 558.7 | 59.9 | 3.5 |
| 2008-11-30 00:00:00 | 3.2 | 8.7 | 12.7 | 56.2 | 2.9 | 611.0 | 55.8 | 2.9 |
| 2008-12-31 00:00:00 | 3.2 | 8.6 | 12.9 | 55.8 | 2.2 | 585.8 | 40.0 | 2.1 |
| 2009-01-31 00:00:00 | 3.4 | 9.4 | 11.5 | 60.8 | 2.8 | 541.0 | 44.8 | 2.6 |
| 2009-02-28 00:00:00 | 3.8 | 9.4 | 10.5 | 60.1 | 3.0 | 522.7 | 46.4 | 2.8 |
| 2009-03-31 00:00:00 | 3.6 | 8.5 | 11.2 | 54.7 | 2.7 | 578.7 | 44.1 | 2.5 |
| 2009-04-30 00:00:00 | 3.3 | 7.8 | 12.2 | 50.0 | 3.1 | 512.1 | 36.5 | 3.0 |
| 2009-05-31 00:00:00 | 3.1 | 7.0 | 12.6 | 48.0 | 3.5 | 430.1 | 28.9 | 3.3 |
| 2009-06-30 00:00:00 | 3.0 | 7.0 | 12.6 | 48.0 | 3.5 | 363.7 | 26.4 | 3.4 |
| 2009-07-31 00:00:00 | 2.7 | 6.5 | 13.5 | 44.7 | 3.5 | 315.0 | 25.9 | 3.3 |
| 2009-08-31 00:00:00 | 2.6 | 5.7 | 13.6 | 47.1 | 3.4 | 298.2 | 26.0 | 3.3 |
| 2009-09-30 00:00:00 | 2.4 | 5.5 | 13.9 | 45.4 | 3.3 | 286.5 | 25.6 | 3.2 |
| 2009-10-31 00:00:00 | 2.4 | 5.6 | 13.6 | 46.3 | 3.4 | 288.7 | 30.7 | 3.3 |
| 2009-11-30 00:00:00 | 2.3 | 5.0 | 14.3 | 45.2 | 3.2 | 300.2 | 24.5 | 3.2 |
| 2009-12-31 00:00:00 | 2.1 | 4.9 | 14.2 | 44.4 | 3.8 | 255.3 | 21.7 | 3.8 |
| 2010-01-31 00:00:00 | 2.2 | 5.1 | 13.6 | 46.1 | 3.6 | 261.6 | 24.6 | 3.5 |
| 2010-02-28 00:00:00 | 2.0 | 5.9 | 14.0 | 46.4 | 3.6 | 261.8 | 19.5 | 3.5 |
| 2010-03-31 00:00:00 | 1.8 | 5.6 | 14.8 | 43.7 | 3.8 | 248.4 | 17.6 | 3.7 |
| 2010-04-30 00:00:00 | 1.8 | 5.5 | 15.0 | 43.1 | 3.7 | 241.7 | 22.1 | 3.5 |
| 2010-05-31 00:00:00 | 2.0 | 6.1 | 13.8 | 48.6 | 3.3 | 290.8 | 32.1 | 3.1 |
| 2010-06-30 00:00:00 | 2.1 | 6.5 | 12.9 | 51.3 | 2.9 | 311.9 | 34.5 | 2.8 |
| 2010-07-31 00:00:00 | 2.0 | 6.1 | 13.7 | 48.0 | 2.9 | 294.5 | 23.5 | 2.8 |
| 2010-08-31 00:00:00 | 2.1 | 7.0 | 12.9 | 51.2 | 2.5 | 301.2 | 26.1 | 2.3 |
| 2010-09-30 00:00:00 | 2.0 | 6.4 | 14.0 | 47.0 | 2.5 | 307.0 | 23.7 | 2.4 |
| 2010-10-31 00:00:00 | 1.9 | 6.2 | 14.4 | 45.4 | 2.6 | 318.1 | 21.2 | 2.5 |
| 2010-11-30 00:00:00 | 2.0 | 6.8 | 14.4 | 47.6 | 2.8 | 304.3 | 23.5 | 2.6 |
| 2010-12-31 00:00:00 | 1.9 | 6.4 | 15.2 | 44.7 | 3.3 | 268.6 | 17.8 | 3.2 |
| 2011-01-31 00:00:00 | 1.8 | 6.2 | 15.3 | 43.7 | 3.4 | 273.0 | 19.5 | 3.2 |
| 2011-02-28 00:00:00 | 1.8 | 6.4 | 15.7 | 43.2 | 3.4 | 256.3 | 18.4 | 3.3 |
| 2011-03-31 00:00:00 | 1.8 | 6.3 | 15.7 | 43.3 | 3.5 | 258.0 | 17.7 | 3.4 |
| 2011-04-30 00:00:00 | 1.8 | 6.2 | 16.1 | 42.1 | 3.3 | 261.4 | 14.8 | 3.3 |
| 2011-05-31 00:00:00 | 1.9 | 6.6 | 15.8 | 44.0 | 3.1 | 263.9 | 15.4 | 3.0 |
| 2011-06-30 00:00:00 | 1.9 | 6.7 | 15.6 | 44.8 | 3.2 | 274.0 | 16.5 | 3.1 |
| 2011-07-31 00:00:00 | 2.0 | 6.8 | 15.2 | 45.8 | 2.8 | 279.4 | 25.2 | 2.7 |
| 2011-08-31 00:00:00 | 2.1 | 7.3 | 14.3 | 50.0 | 2.2 | 325.7 | 31.6 | 2.2 |
| 2011-09-30 00:00:00 | 2.3 | 7.9 | 13.3 | 53.9 | 1.9 | 337.5 | 43.0 | 1.9 |
| 2011-10-31 00:00:00 | 2.1 | 7.1 | 14.7 | 48.7 | 2.1 | 321.7 | 30.0 | 2.1 |
| 2011-11-30 00:00:00 | 2.1 | 7.3 | 14.6 | 48.9 | 2.1 | 315.2 | 27.8 | 2.1 |
| 2011-12-31 00:00:00 | 2.1 | 7.2 | 14.8 | 48.4 | 1.9 | 330.4 | 23.4 | 1.9 |
| 2012-01-31 00:00:00 | 2.1 | 6.9 | 14.8 | 46.4 | 1.8 | 331.2 | 19.4 | 1.7 |
| 2012-02-29 00:00:00 | 2.0 | 7.0 | 15.3 | 44.7 | 2.0 | 307.1 | 18.4 | 1.9 |
| 2012-03-31 00:00:00 | 2.0 | 6.8 | 15.8 | 43.3 | 2.2 | 300.1 | 15.5 | 2.1 |
| 2012-04-30 00:00:00 | 2.0 | 6.8 | 15.6 | 43.7 | 1.9 | 323.1 | 17.1 | 1.8 |
| 2012-05-31 00:00:00 | 2.2 | 7.5 | 14.7 | 48.0 | 1.6 | 346.4 | 24.1 | 1.5 |
| 2012-06-30 00:00:00 | 2.1 | 7.2 | 15.2 | 46.2 | 1.6 | 332.5 | 17.1 | 1.6 |
| 2012-07-31 00:00:00 | 2.1 | 7.1 | 15.3 | 45.6 | 1.5 | 331.0 | 18.9 | 1.4 |
| 2012-08-31 00:00:00 | 2.1 | 7.0 | 15.6 | 45.5 | 1.5 | 328.2 | 17.5 | 1.5 |
| 2012-09-30 00:00:00 | 2.1 | 6.9 | 16.0 | 44.4 | 1.6 | 307.6 | 15.7 | 1.5 |
| 2012-10-31 00:00:00 | 2.1 | 7.0 | 15.6 | 45.3 | 1.7 | 287.8 | 18.6 | 1.6 |
| 2012-11-30 00:00:00 | 2.2 | 7.0 | 15.5 | 46.5 | 1.6 | 295.4 | 15.9 | 1.5 |
| 2012-12-31 00:00:00 | 2.2 | 7.0 | 15.6 | 46.2 | 1.8 | 282.3 | 18.0 | 1.7 |
| 2013-01-31 00:00:00 | 2.1 | 6.7 | 16.1 | 44.0 | 2.0 | 287.5 | 14.3 | 1.9 |
| 2013-02-28 00:00:00 | 2.2 | 6.7 | 16.2 | 43.4 | 1.9 | 293.8 | 15.5 | 1.8 |
| 2013-03-31 00:00:00 | 2.1 | 6.5 | 16.8 | 42.3 | 1.8 | 298.1 | 12.7 | 1.8 |
| 2013-04-30 00:00:00 | 2.1 | 6.4 | 17.1 | 41.6 | 1.7 | 285.3 | 13.5 | 1.6 |
| 2013-05-31 00:00:00 | 2.1 | 6.3 | 17.4 | 41.5 | 2.1 | 277.2 | 16.3 | 2.1 |
| 2013-06-30 00:00:00 | 2.1 | 6.4 | 17.1 | 42.1 | 2.5 | 292.4 | 16.9 | 2.5 |
| 2013-07-31 00:00:00 | 2.1 | 6.1 | 17.9 | 40.1 | 2.6 | 272.2 | 13.4 | 2.5 |
| 2013-08-31 00:00:00 | 2.1 | 6.7 | 17.3 | 41.4 | 2.8 | 258.6 | 17.0 | 2.8 |
| 2013-09-30 00:00:00 | 2.1 | 6.5 | 17.7 | 40.2 | 2.6 | 272.9 | 16.6 | 2.6 |
| 2013-10-31 00:00:00 | 2.0 | 6.2 | 18.6 | 38.5 | 2.6 | 267.3 | 13.8 | 2.5 |
| 2013-11-30 00:00:00 | 2.0 | 6.2 | 19.1 | 38.2 | 2.7 | 259.6 | 13.7 | 2.7 |
| 2013-12-31 00:00:00 | 1.9 | 6.1 | 19.5 | 37.4 | 3.0 | 231.2 | 13.7 | 3.0 |
| 2014-01-31 00:00:00 | 2.0 | 6.3 | 18.6 | 38.8 | 2.6 | 243.6 | 18.4 | 2.6 |
| 2014-02-28 00:00:00 | 1.9 | 5.7 | 19.3 | 38.3 | 2.6 | 236.2 | 14.0 | 2.6 |
| 2014-03-31 00:00:00 | 1.9 | 5.8 | 19.5 | 38.1 | 2.7 | 224.3 | 13.9 | 2.7 |
| 2014-04-30 00:00:00 | 1.9 | 5.8 | 19.6 | 37.9 | 2.6 | 221.1 | 13.4 | 2.6 |
| 2014-05-31 00:00:00 | 1.9 | 5.7 | 20.1 | 37.2 | 2.5 | 221.4 | 11.4 | 2.4 |
| 2014-06-30 00:00:00 | 1.9 | 5.6 | 20.4 | 36.5 | 2.5 | 221.5 | 11.6 | 2.5 |
| 2014-07-31 00:00:00 | 2.0 | 5.7 | 20.1 | 37.1 | 2.6 | 216.9 | 16.9 | 2.5 |
| 2014-08-31 00:00:00 | 1.9 | 5.6 | 20.8 | 36.5 | 2.3 | 222.7 | 12.0 | 2.3 |
| 2014-09-30 00:00:00 | 2.0 | 5.7 | 20.4 | 37.1 | 2.5 | 227.3 | 16.3 | 2.5 |
| 2014-10-31 00:00:00 | 1.9 | 5.6 | 20.9 | 36.2 | 2.3 | 237.5 | 14.0 | 2.3 |
| 2014-11-30 00:00:00 | 1.9 | 5.6 | 21.4 | 35.5 | 2.2 | 256.6 | 13.3 | 2.2 |
| 2014-12-31 00:00:00 | 2.0 | 5.6 | 21.2 | 35.7 | 2.2 | 251.9 | 19.2 | 2.1 |
| 2015-01-31 00:00:00 | 2.0 | 5.8 | 20.4 | 36.8 | 1.6 | 270.9 | 21.0 | 1.6 |
| 2015-02-28 00:00:00 | 1.9 | 5.5 | 21.5 | 34.5 | 2.0 | 247.7 | 13.3 | 2.0 |
| 2015-03-31 00:00:00 | 2.0 | 5.6 | 21.1 | 35.1 | 1.9 | 258.7 | 15.3 | 1.9 |
| 2015-04-30 00:00:00 | 2.0 | 5.5 | 21.3 | 34.8 | 2.0 | 259.1 | 14.6 | 2.0 |
| 2015-05-31 00:00:00 | 2.0 | 5.5 | 21.6 | 34.5 | 2.1 | 275.9 | 13.8 | 2.1 |
| 2015-06-30 00:00:00 | 2.1 | 5.6 | 21.1 | 35.3 | 2.4 | 280.4 | 18.2 | 2.3 |
| 2015-07-31 00:00:00 | 2.0 | 5.5 | 21.5 | 34.6 | 2.2 | 298.0 | 12.1 | 2.1 |
| 2015-08-31 00:00:00 | 2.2 | 5.8 | 20.2 | 37.1 | 2.2 | 312.9 | 28.4 | 2.2 |
| 2015-09-30 00:00:00 | 2.2 | 6.0 | 19.6 | 38.2 | 2.0 | 325.0 | 24.5 | 2.1 |
| 2015-10-31 00:00:00 | 2.1 | 5.5 | 21.1 | 35.2 | 2.1 | 325.8 | 15.1 | 2.1 |
| 2015-11-30 00:00:00 | 2.1 | 5.5 | 21.3 | 35.3 | 2.2 | 321.6 | 16.1 | 2.0 |
| 2015-12-31 00:00:00 | 2.1 | 5.5 | 21.0 | 36.0 | 2.3 | 327.1 | 18.2 | 2.1 |
| 2016-01-31 00:00:00 | 2.3 | 5.9 | 19.7 | 37.9 | 1.9 | 355.9 | 20.2 | 1.6 |
| 2016-02-29 00:00:00 | 2.3 | 5.9 | 19.5 | 37.9 | 1.7 | 360.6 | 20.6 | 1.4 |
| 2016-03-31 00:00:00 | 2.2 | 5.5 | 20.9 | 35.5 | 1.8 | 314.0 | 13.9 | 1.6 |
| 2016-04-30 00:00:00 | 2.2 | 5.5 | 20.9 | 35.4 | 1.8 | 289.7 | 15.7 | 1.6 |
| 2016-05-31 00:00:00 | 2.2 | 5.2 | 21.2 | 35.3 | 1.8 | 284.7 | 14.2 | 1.6 |
| 2016-06-30 00:00:00 | 2.2 | 5.2 | 21.2 | 35.3 | 1.5 | 294.4 | 15.6 | 1.2 |
| 2016-07-31 00:00:00 | 2.1 | 5.1 | 21.9 | 34.2 | 1.5 | 274.7 | 11.9 | 1.2 |
| 2016-08-31 00:00:00 | 2.1 | 5.0 | 21.9 | 34.6 | 1.6 | 261.3 | 13.4 | 1.3 |
| 2016-09-30 00:00:00 | 2.1 | 5.0 | 21.7 | 34.8 | 1.6 | 263.6 | 13.3 | 1.3 |
| 2016-10-31 00:00:00 | 2.2 | 5.1 | 21.3 | 35.5 | 1.8 | 262.0 | 17.1 | 1.5 |
| 2016-11-30 00:00:00 | 2.1 | 5.0 | 22.0 | 35.0 | 2.4 | 237.2 | 13.3 | 1.9 |
| 2016-12-31 00:00:00 | 2.1 | 4.9 | 22.5 | 34.3 | 2.4 | 231.6 | 14.0 | 1.9 |
| 2017-01-31 00:00:00 | 2.1 | 4.8 | 22.6 | 33.7 | 2.5 | 222.8 | 12.0 | 1.9 |
| 2017-02-28 00:00:00 | 2.0 | 4.7 | 23.5 | 32.1 | 2.4 | 215.3 | 12.9 | 1.8 |
| 2017-03-31 00:00:00 | 2.0 | 4.7 | 23.5 | 32.1 | 2.4 | 226.3 | 12.4 | 1.6 |
| 2017-04-30 00:00:00 | 2.0 | 4.6 | 23.8 | 31.8 | 2.3 | 230.0 | 10.8 | 1.5 |
| 2017-05-31 00:00:00 | 2.0 | 4.8 | 24.0 | 32.1 | 2.2 | 225.2 | 10.4 | 1.2 |
| 2017-06-30 00:00:00 | 2.0 | 4.7 | 24.1 | 31.9 | 2.3 | 205.6 | 11.2 | 1.3 |
| 2017-07-31 00:00:00 | 2.0 | 4.6 | 24.6 | 31.3 | 2.3 | 205.2 | 10.3 | 1.2 |
| 2017-08-31 00:00:00 | 2.0 | 4.8 | 24.6 | 31.9 | 2.1 | 216.3 | 10.6 | 1.1 |
| 2017-09-30 00:00:00 | 2.0 | 4.7 | 25.0 | 31.3 | 2.3 | 202.6 | 9.5 | 1.3 |
| 2017-10-31 00:00:00 | 1.9 | 4.6 | 25.3 | 30.6 | 2.4 | 190.0 | 10.2 | 1.2 |
| 2017-11-30 00:00:00 | 1.9 | 4.6 | 26.1 | 30.3 | 2.4 | 188.2 | 11.3 | 1.2 |
| 2017-12-31 00:00:00 | 1.9 | 4.6 | 26.3 | 30.0 | 2.4 | 178.5 | 11.0 | 1.0 |
| 2018-01-31 00:00:00 | 1.8 | 4.3 | 27.0 | 28.5 | 2.7 | 159.1 | 13.5 | 1.2 |
| 2018-02-28 00:00:00 | 1.9 | 4.6 | 25.9 | 29.9 | 2.9 | 172.6 | 19.9 | 1.2 |
| 2018-03-31 00:00:00 | 2.0 | 4.7 | 25.3 | 30.7 | 2.7 | 189.1 | 20.0 | 1.0 |
| 2018-04-30 00:00:00 | 2.0 | 4.7 | 25.4 | 30.6 | 3.0 | 180.7 | 15.9 | 1.2 |
| 2018-05-31 00:00:00 | 1.9 | 4.9 | 26.0 | 30.2 | 2.9 | 187.5 | 15.4 | 1.0 |
| 2018-06-30 00:00:00 | 1.9 | 4.9 | 26.0 | 30.2 | 2.9 | 198.0 | 16.1 | 0.9 |
| 2018-07-31 00:00:00 | 1.8 | 4.8 | 26.9 | 29.1 | 3.0 | 184.9 | 12.8 | 0.9 |
| 2018-08-31 00:00:00 | 1.8 | 4.8 | 27.6 | 28.3 | 2.9 | 190.0 | 12.9 | 0.8 |
| 2018-09-30 00:00:00 | 1.8 | 4.8 | 27.7 | 28.2 | 3.1 | 182.9 | 12.1 | 0.9 |
| 2018-10-31 00:00:00 | 1.9 | 5.2 | 25.6 | 30.3 | 3.1 | 198.9 | 21.2 | 0.8 |
| 2018-11-30 00:00:00 | 1.9 | 5.4 | 26.0 | 30.0 | 3.0 | 230.2 | 18.1 | 0.6 |
| 2018-12-31 00:00:00 | 2.1 | 6.0 | 23.5 | 33.1 | 2.7 | 247.6 | 25.4 | 0.3 |
| 2019-01-31 00:00:00 | 2.0 | 5.5 | 24.1 | 30.7 | 2.6 | 244.1 | 16.6 | 0.2 |
| 2019-02-28 00:00:00 | 2.0 | 5.5 | 24.9 | 30.1 | 2.7 | 222.3 | 14.8 | 0.3 |
| 2019-03-31 00:00:00 | 1.9 | 5.4 | 25.4 | 29.5 | 2.4 | 225.5 | 13.7 | 0.0 |
| 2019-04-30 00:00:00 | 1.9 | 5.2 | 26.3 | 28.4 | 2.5 | 216.8 | 13.1 | 0.1 |
| 2019-05-31 00:00:00 | 2.0 | 5.6 | 24.6 | 31.2 | 2.1 | 242.5 | 18.7 | -0.2 |
| 2019-06-30 00:00:00 | 1.9 | 5.2 | 26.3 | 29.2 | 2.0 | 231.5 | 15.1 | -0.1 |
| 2019-07-31 00:00:00 | 1.9 | 5.2 | 26.5 | 28.7 | 2.0 | 216.3 | 16.1 | -0.0 |
| 2019-08-31 00:00:00 | 1.9 | 5.3 | 26.0 | 29.7 | 1.5 | 227.4 | 19.0 | -0.5 |
| 2019-09-30 00:00:00 | 1.9 | 5.2 | 26.4 | 29.2 | 1.7 | 219.6 | 16.2 | -0.1 |
| 2019-10-31 00:00:00 | 1.9 | 5.1 | 26.8 | 28.6 | 1.7 | 225.7 | 13.2 | 0.2 |
| 2019-11-30 00:00:00 | 1.9 | 4.9 | 27.7 | 28.2 | 1.8 | 207.4 | 12.6 | 0.2 |
| 2019-12-31 00:00:00 | 1.8 | 4.7 | 28.4 | 27.5 | 1.9 | 195.2 | 13.8 | 0.4 |
| 2020-01-31 00:00:00 | 1.8 | 4.7 | 27.1 | 27.5 | 1.5 | 214.3 | 18.8 | -0.0 |
| 2020-02-29 00:00:00 | 2.0 | 5.3 | 24.7 | 30.4 | 1.1 | 242.1 | 40.1 | -0.1 |
| 2020-03-31 00:00:00 | 2.3 | 6.0 | 21.7 | 34.7 | 0.7 | 394.1 | 53.5 | 0.6 |
| 2020-04-30 00:00:00 | 2.1 | 5.3 | 24.4 | 30.8 | 0.6 | 325.4 | 34.1 | 0.6 |
| 2020-05-31 00:00:00 | 2.0 | 4.8 | 25.5 | 28.6 | 0.7 | 314.7 | 27.5 | 0.5 |
| 2020-06-30 00:00:00 | 2.0 | 4.7 | 26.1 | 28.0 | 0.7 | 290.4 | 30.4 | 0.5 |
| 2020-07-31 00:00:00 | 1.9 | 4.5 | 27.4 | 26.8 | 0.5 | 262.2 | 24.5 | 0.4 |
| 2020-08-31 00:00:00 | 1.7 | 3.8 | 29.3 | 25.3 | 0.7 | 274.0 | 26.4 | 0.6 |
| 2020-09-30 00:00:00 | 1.8 | 3.9 | 28.0 | 26.3 | 0.7 | 271.1 | 26.4 | 0.6 |
| 2020-10-31 00:00:00 | 1.8 | 4.1 | 27.1 | 27.1 | 0.9 | 258.6 | 38.0 | 0.8 |
| 2020-11-30 00:00:00 | 1.7 | 3.6 | 29.9 | 25.0 | 0.8 | 231.4 | 20.6 | 0.8 |
| 2020-12-31 00:00:00 | 1.6 | 3.5 | 31.0 | 24.1 | 0.9 | 221.7 | 22.8 | 0.9 |
| 2021-01-31 00:00:00 | 1.6 | 3.5 | 30.0 | 24.4 | 1.1 | 217.4 | 33.1 | 1.0 |
| 2021-02-28 00:00:00 | 1.5 | 3.3 | 30.8 | 24.0 | 1.4 | 225.5 | 27.9 | 1.4 |
| 2021-03-31 00:00:00 | 1.5 | 3.2 | 32.2 | 22.9 | 1.7 | 203.1 | 19.4 | 1.7 |
| 2021-04-30 00:00:00 | 1.4 | 3.0 | 33.9 | 21.8 | 1.6 | 199.4 | 18.6 | 1.6 |
| 2021-05-31 00:00:00 | 1.4 | 3.4 | 34.1 | 21.9 | 1.6 | 195.5 | 16.8 | 1.6 |
| 2021-06-30 00:00:00 | 1.4 | 3.4 | 34.8 | 21.5 | 1.5 | 189.2 | 15.8 | 1.4 |
| 2021-07-31 00:00:00 | 1.3 | 3.3 | 35.3 | 21.0 | 1.2 | 196.8 | 18.2 | 1.2 |
| 2021-08-31 00:00:00 | 1.3 | 3.7 | 36.3 | 21.1 | 1.3 | 187.8 | 16.5 | 1.3 |
| 2021-09-30 00:00:00 | 1.4 | 3.9 | 34.2 | 22.2 | 1.5 | 187.8 | 23.1 | 1.5 |
| 2021-10-31 00:00:00 | 1.3 | 3.7 | 36.2 | 20.7 | 1.6 | 170.8 | 16.3 | 1.5 |
| 2021-11-30 00:00:00 | 1.3 | 4.0 | 35.8 | 21.2 | 1.4 | 185.2 | 27.2 | 1.4 |
| 2021-12-31 00:00:00 | 1.3 | 3.9 | 37.7 | 20.3 | 1.5 | 186.0 | 17.2 | 1.5 |
| 2022-01-31 00:00:00 | 1.3 | 4.1 | 32.4 | 21.4 | 1.8 | 192.2 | 24.8 | 1.6 |
| 2022-02-28 00:00:00 | 1.4 | 4.5 | 31.5 | 22.7 | 1.8 | 231.9 | 30.1 | 1.5 |
| 2022-03-31 00:00:00 | 1.4 | 4.4 | 32.5 | 21.9 | 2.3 | 188.9 | 20.6 | 1.9 |
| 2022-04-30 00:00:00 | 1.5 | 4.8 | 29.7 | 24.0 | 2.9 | 197.6 | 33.4 | 2.1 |
| 2022-05-31 00:00:00 | 1.5 | 4.9 | 29.8 | 24.0 | 2.8 | 213.6 | 26.2 | 1.8 |
| 2022-06-30 00:00:00 | 1.7 | 5.4 | 27.2 | 26.2 | 3.0 | 236.0 | 28.7 | 1.4 |
| 2022-07-31 00:00:00 | 1.6 | 4.9 | 29.3 | 24.0 | 2.6 | 245.1 | 21.3 | 0.3 |
| 2022-08-31 00:00:00 | 1.7 | 5.3 | 28.0 | 24.9 | 3.2 | 207.6 | 25.9 | 0.3 |
| 2022-09-30 00:00:00 | 1.8 | 5.8 | 25.1 | 27.5 | 3.8 | 220.1 | 31.6 | 0.6 |
| 2022-10-31 00:00:00 | 1.7 | 5.4 | 26.9 | 25.5 | 4.0 | 229.9 | 25.9 | -0.0 |
| 2022-11-30 00:00:00 | 1.6 | 5.2 | 28.5 | 24.0 | 3.6 | 218.6 | 20.6 | -0.7 |
| 2022-12-31 00:00:00 | 1.8 | 5.5 | 26.9 | 25.5 | 3.9 | 187.5 | 21.7 | -0.5 |
| 2023-01-31 00:00:00 | 1.7 | 5.2 | 26.5 | 24.1 | 3.5 | 191.3 | 19.4 | -1.1 |
| 2023-02-28 00:00:00 | 1.7 | 5.3 | 25.8 | 25.5 | 3.9 | 185.6 | 20.7 | -0.8 |
| 2023-03-31 00:00:00 | 1.7 | 5.1 | 26.8 | 24.6 | 3.5 | 216.4 | 18.7 | -1.2 |
| 2023-04-30 00:00:00 | 1.7 | 5.0 | 27.2 | 24.2 | 3.4 | 217.8 | 15.8 | -1.6 |
| 2023-05-31 00:00:00 | 1.7 | 5.0 | 27.3 | 24.7 | 3.6 | 216.6 | 17.9 | -1.7 |
| 2023-06-30 00:00:00 | 1.6 | 4.7 | 29.0 | 23.2 | 3.8 | 185.3 | 13.6 | -1.4 |
| 2023-07-31 00:00:00 | 1.5 | 4.6 | 29.8 | 22.5 | 4.0 | 179.9 | 13.6 | -1.4 |
| 2023-08-31 00:00:00 | 1.5 | 4.6 | 29.3 | 23.3 | 4.1 | 183.8 | 13.6 | -1.3 |
| 2023-09-30 00:00:00 | 1.6 | 4.8 | 27.9 | 24.5 | 4.6 | 181.9 | 17.5 | -0.9 |
| 2023-10-31 00:00:00 | 1.7 | 4.9 | 26.9 | 25.0 | 4.9 | 182.2 | 18.1 | -0.5 |
| 2023-11-30 00:00:00 | 1.5 | 4.6 | 29.3 | 23.2 | 4.3 | 165.4 | 12.9 | -1.1 |
| 2023-12-31 00:00:00 | 1.5 | 4.4 | 30.7 | 22.3 | 3.9 | 158.1 | 12.4 | -1.5 |
| 2024-01-31 00:00:00 | 1.5 | 4.3 | 29.5 | 21.9 | 3.9 | 170.1 | 14.3 | -1.4 |
| 2024-02-29 00:00:00 | 1.4 | 4.1 | 30.9 | 21.3 | 4.3 | 158.2 | 13.4 | -1.1 |
| 2024-03-31 00:00:00 | 1.4 | 4.0 | 32.0 | 20.8 | 4.2 | 154.0 | 13.0 | -1.2 |
| 2024-04-30 00:00:00 | 1.4 | 4.2 | 30.7 | 21.7 | 4.7 | 141.3 | 15.7 | -0.7 |
| 2024-05-31 00:00:00 | 1.4 | 4.1 | 32.1 | 20.8 | 4.5 | 151.2 | 12.9 | -0.9 |
| 2024-06-30 00:00:00 | 1.3 | 4.0 | 33.3 | 20.2 | 4.4 | 144.4 | 12.4 | -1.0 |
| 2024-07-31 00:00:00 | 1.3 | 3.9 | 33.5 | 20.0 | 4.0 | 174.7 | 16.4 | -1.3 |
| 2024-08-31 00:00:00 | 1.3 | 3.9 | 34.2 | 19.8 | 3.9 | 165.7 | 15.0 | -1.2 |
| 2024-09-30 00:00:00 | 1.3 | 3.8 | 34.7 | 19.5 | 3.8 | 163.1 | 16.7 | -0.8 |
| 2024-10-31 00:00:00 | 1.3 | 3.9 | 34.2 | 19.7 | 4.3 | 145.2 | 23.2 | -0.3 |
| 2024-11-30 00:00:00 | 1.2 | 3.7 | 36.1 | 19.1 | 4.2 | 156.2 | 13.5 | -0.3 |
| 2024-12-31 00:00:00 | 1.3 | 3.8 | 35.3 | 19.6 | 4.6 | 141.1 | 17.4 | 0.3 |
| 2025-01-31 00:00:00 | 1.2 | 3.7 | 34.1 | 19.1 | 4.5 | 143.1 | 16.4 | 0.3 |
| 2025-02-28 00:00:00 | 1.3 | 3.9 | 33.5 | 19.6 | 4.2 | 160.2 | 19.6 | -0.1 |
| 2025-03-31 00:00:00 | 1.4 | 4.2 | 31.7 | 20.7 | 4.2 | 179.1 | 22.3 | -0.1 |
| 2025-04-30 00:00:00 | 1.4 | 4.2 | 31.3 | 20.9 | 4.2 | 188.9 | 24.7 | -0.1 |
| 2025-05-31 00:00:00 | 1.3 | 4.0 | 33.2 | 20.0 | 4.4 | 184.0 | 18.6 | 0.1 |
| 2025-06-30 00:00:00 | 1.2 | 3.8 | 34.8 | 19.1 | 4.2 | 186.2 | 16.7 | -0.1 |
| 2025-07-31 00:00:00 | 1.2 | 3.7 | 35.3 | 18.7 | 4.4 | 169.2 | 16.7 | 0.0 |
| 2025-08-31 00:00:00 | 1.2 | 3.7 | 36.2 | 18.9 | 4.2 | 174.2 | 15.4 | 0.1 |
| 2025-09-30 00:00:00 | 1.2 | 3.6 | 37.4 | 18.3 | 4.2 | 164.2 | 16.3 | 0.2 |
| 2025-10-31 00:00:00 | 1.1 | 3.5 | 38.2 | 17.9 | 4.1 | 167.2 | 17.4 | 0.3 |
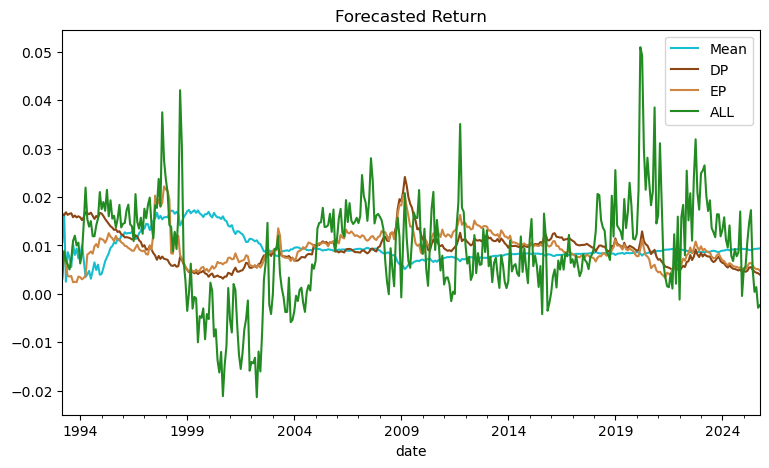
# Output from previous execution
| Mean | DP | EP | ALL | |
|---|---|---|---|---|
| date | ||||
| 1993-03-31 | 1.1% | 1.6% | 0.6% | 0.3% |
| 1993-04-30 | 1.7% | 1.6% | 0.8% | 0.9% |
| 1993-05-31 | 0.2% | 1.7% | 0.6% | 0.7% |
| Mean | DP | EP | ALL | |
|---|---|---|---|---|
| date | ||||
| 2025-08-31 | 0.9% | 0.4% | 0.5% | 0.1% |
| 2025-09-30 | 0.9% | 0.4% | 0.5% | -0.3% |
| 2025-10-31 | 0.9% | 0.4% | 0.5% | -0.2% |
# Output from previous execution
# Output from previous execution
| Passive | Mean | DP | EP | ALL | |
|---|---|---|---|---|---|
| date | |||||
| 1993-03-31 | 2.2% | 2.4% | 3.7% | 1.4% | 0.7% |
| 1993-04-30 | -2.6% | -4.2% | -4.2% | -2.0% | -2.3% |
| 1993-05-31 | 2.7% | 0.7% | 4.5% | 1.6% | 1.8% |
| Passive | Mean | DP | EP | ALL | |
|---|---|---|---|---|---|
| date | |||||
| 2025-08-31 | 2.1% | 1.9% | 0.9% | 1.0% | 0.3% |
| 2025-09-30 | 3.6% | 3.3% | 1.5% | 1.8% | -1.0% |
| 2025-10-31 | 2.4% | 2.2% | 0.9% | 1.1% | -0.6% |
# Output from previous execution
| Mean | DP | EP | ALL | |
|---|---|---|---|---|
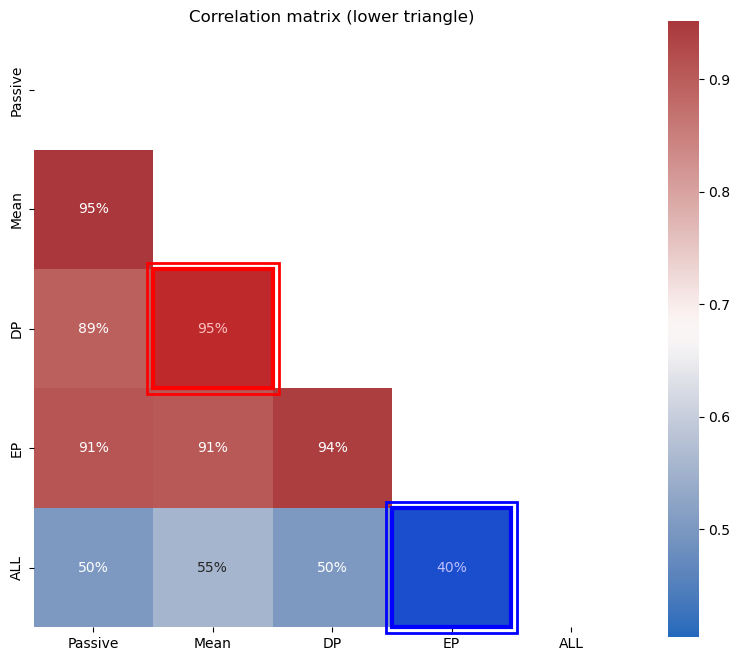
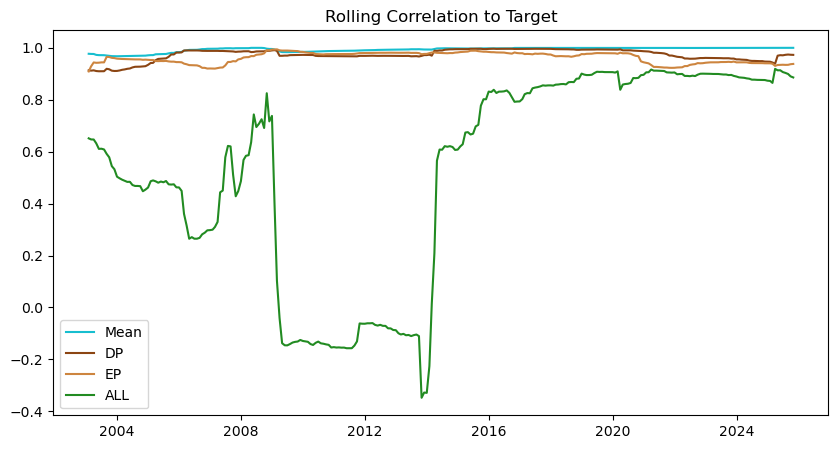
| OOS-Rsquared | 0.0% | 1.6% | 1.6% | 6.6% |
| Corr. between forecast and target | -3.6% | 8.2% | 8.0% | 23.9% |

| Mean | Vol | Sharpe | Min | Max | |
|---|---|---|---|---|---|
| Passive | 11.3% | 14.8% | 76.6% | -16.5% | 12.7% |
| Mean | 10.2% | 15.0% | 68.2% | -23.3% | 15.3% |
| DP | 12.1% | 15.6% | 78.0% | -22.7% | 22.3% |
| EP | 12.1% | 16.1% | 74.9% | -21.9% | 17.9% |
| ALL | 23.1% | 27.4% | 84.4% | -63.5% | 62.5% |
| Skewness | Kurtosis | VaR (0.05) | CVaR (0.05) | Max Drawdown | Peak | Bottom | Recover | Duration (to Recover) | |
|---|---|---|---|---|---|---|---|---|---|
| Passive | -59.5% | 98.1% | -7.0% | -9.4% | -50.8% | 2007-10-31 | 2009-02-28 | 2012-03-31 | 1613 days |
| Mean | -57.6% | 282.9% | -6.9% | -9.5% | -51.7% | 2000-08-31 | 2002-09-30 | 2013-07-31 | 4717 days |
| DP | -46.0% | 610.1% | -6.0% | -9.9% | -66.1% | 2007-10-31 | 2009-02-28 | 2012-02-29 | 1582 days |
| EP | -47.4% | 440.4% | -6.1% | -10.7% | -65.2% | 2007-10-31 | 2009-02-28 | 2012-08-31 | 1766 days |
| ALL | 38.0% | 2312.6% | -6.9% | -14.4% | -69.7% | 2019-12-31 | 2020-03-31 | 2020-12-31 | 366 days |
| alpha | SPY | r-squared | Treynor Ratio | Info Ratio | |
|---|---|---|---|---|---|
| Passive | -0.00% | 1.00 | 100.00% | 11.32% | |
| Mean | -0.67% | 0.96 | 89.85% | 10.62% | -14.10% |
| DP | 1.24% | 0.96 | 83.64% | 12.60% | 19.65% |
| EP | 0.56% | 1.02 | 86.82% | 11.87% | 9.64% |
| ALL | 9.04% | 1.24 | 45.03% | 18.58% | 44.52% |
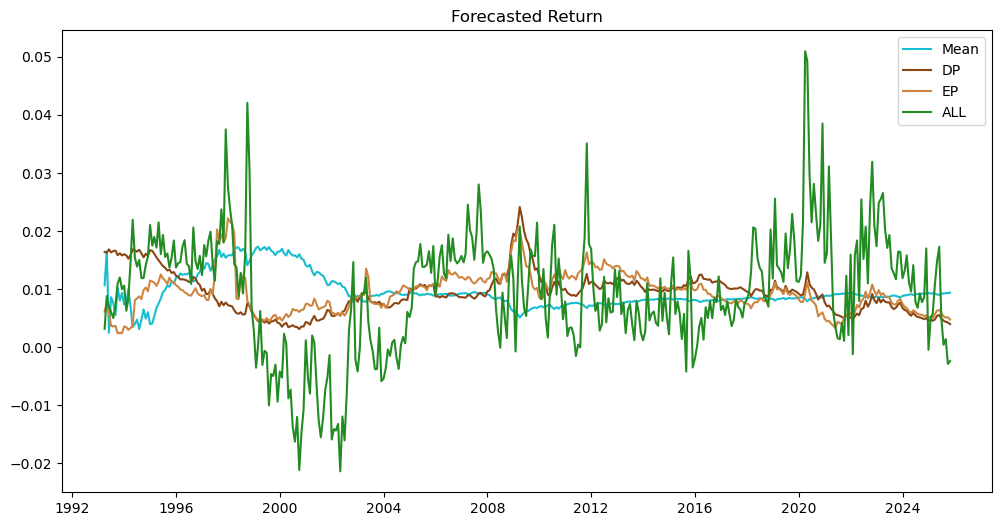
# Output from previous execution
| Mean | DP | EP | ALL | |
|---|---|---|---|---|
| date | ||||
| 1998-02-28 | 1.6% | 2.3% | 3.2% | 1.6% |
| 1998-03-31 | 1.7% | 2.8% | 3.3% | 1.2% |
| 1998-04-30 | 1.7% | 3.0% | 1.4% | 1.7% |
| Mean | DP | EP | ALL | |
|---|---|---|---|---|
| date | ||||
| 2025-08-31 | 0.9% | 0.4% | 0.5% | 0.0% |
| 2025-09-30 | 0.9% | 0.4% | 0.5% | -0.4% |
| 2025-10-31 | 0.9% | 0.4% | 0.5% | -0.3% |
# Output from previous execution
| Passive | Mean | DP | EP | ALL | |
|---|---|---|---|---|---|
| date | |||||
| 1998-02-28 | 6.9% | 11.0% | 16.1% | 21.9% | 10.9% |
| 1998-03-31 | 4.9% | 8.1% | 13.5% | 16.0% | 5.6% |
| 1998-04-30 | 1.3% | 2.2% | 3.9% | 1.8% | 2.2% |
| Passive | Mean | DP | EP | ALL | |
|---|---|---|---|---|---|
| date | |||||
| 2025-08-31 | 2.1% | 1.9% | 0.8% | 1.0% | 0.0% |
| 2025-09-30 | 3.6% | 3.3% | 1.4% | 1.7% | -1.5% |
| 2025-10-31 | 2.4% | 2.2% | 0.9% | 1.1% | -0.7% |
# Output from previous execution
| Mean | DP | EP | ALL | |
|---|---|---|---|---|
| OOS-Rsquared | 0.0% | -0.4% | -0.2% | -6.8% |
| Corr. between forecast and target | -5.4% | -2.0% | -1.4% | 4.8% |


| Mean | Vol | Sharpe | Min | Max | |
|---|---|---|---|---|---|
| Passive | 9.9% | 15.4% | 64.8% | -16.5% | 12.7% |
| Mean | 8.6% | 15.2% | 56.3% | -23.3% | 15.3% |
| DP | 8.6% | 16.8% | 51.4% | -33.5% | 16.1% |
| EP | 9.1% | 17.0% | 53.4% | -28.2% | 21.9% |
| ALL | 14.9% | 36.5% | 40.8% | -68.9% | 54.6% |
| Skewness | Kurtosis | VaR (0.05) | CVaR (0.05) | Max Drawdown | Peak | Bottom | Recover | Duration (to Recover) | |
|---|---|---|---|---|---|---|---|---|---|
| Passive | -56.3% | 84.8% | -7.6% | -9.8% | -50.8% | 2007-10-31 | 2009-02-28 | 2012-03-31 | 1613 days |
| Mean | -64.5% | 297.0% | -7.3% | -9.8% | -51.7% | 2000-08-31 | 2002-09-30 | 2013-07-31 | 4717 days |
| DP | -108.5% | 878.1% | -6.6% | -11.3% | -55.2% | 2007-10-31 | 2009-02-28 | 2013-07-31 | 2100 days |
| EP | -75.8% | 623.5% | -6.9% | -11.6% | -64.3% | 2007-10-31 | 2009-02-28 | 2013-10-31 | 2192 days |
| ALL | -121.9% | 1390.5% | -10.4% | -26.4% | -83.6% | 2000-03-31 | 2011-09-30 | 2019-04-30 | 6969 days |
| alpha | SPY | r-squared | Treynor Ratio | Info Ratio | |
|---|---|---|---|---|---|
| Passive | 0.00% | 1.00 | 100.00% | 9.94% | |
| Mean | -0.81% | 0.94 | 90.46% | 9.08% | -17.24% |
| DP | -1.09% | 0.98 | 79.93% | 8.83% | -14.52% |
| EP | -0.95% | 1.01 | 82.93% | 9.00% | -13.48% |
| ALL | 3.03% | 1.20 | 25.27% | 12.48% | 9.59% |
# Output from previous execution
/var/folders/zx/3v_qt0957xzg3nqtnkv007d00000gn/T/ipykernel_48253/944787420.py:17: FutureWarning: Series.ravel is deprecated. The underlying array is already 1D, so ravel is not necessary.  Use `to_numpy()` for conversion to a numpy array instead.
  y = spy.squeeze('columns').ravel()
/opt/miniconda3/envs/env-finm-2025/lib/python3.10/site-packages/sklearn/neural_network/_multilayer_perceptron.py:780: ConvergenceWarning: Stochastic Optimizer: Maximum iterations (500) reached and the optimization hasn't converged yet.
  warnings.warn(
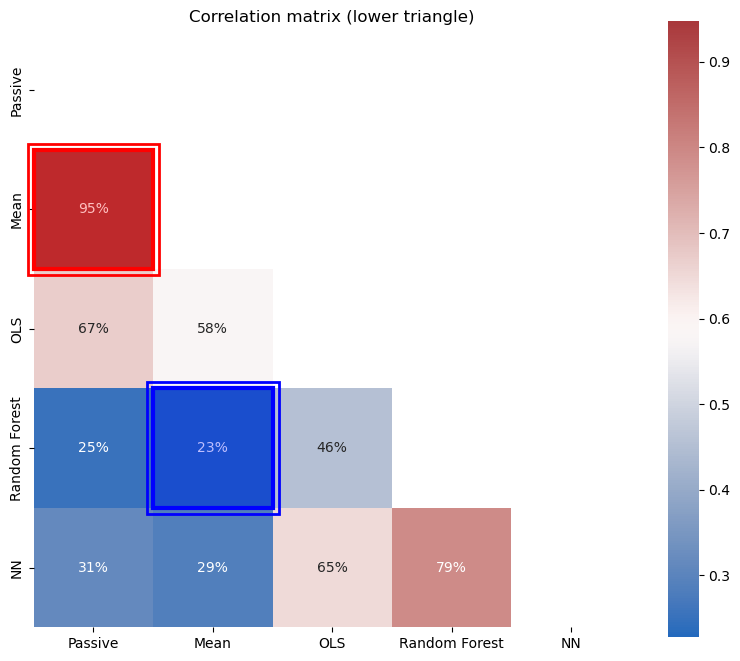
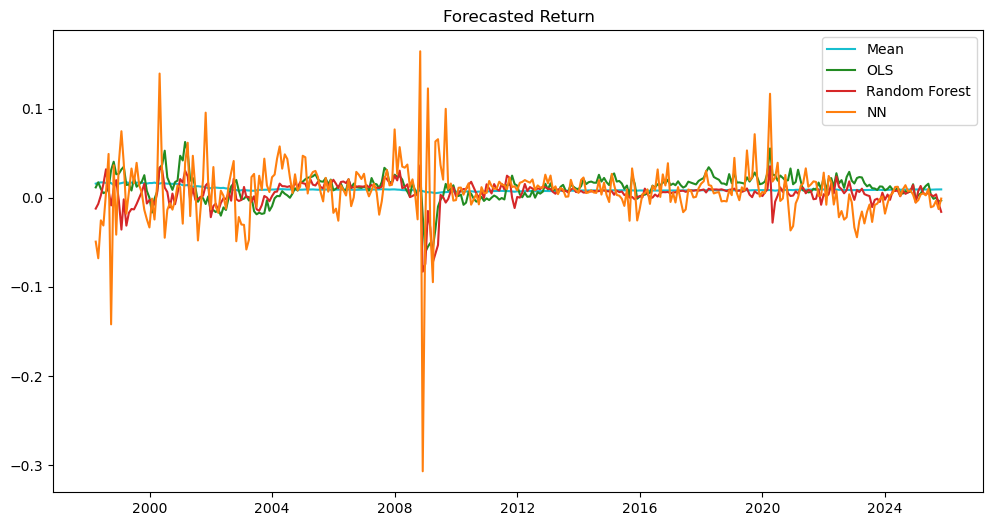
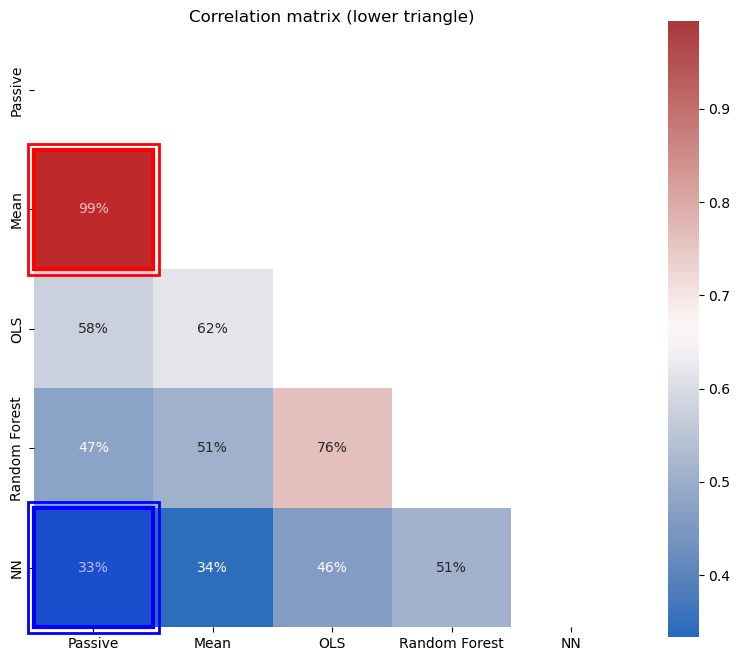
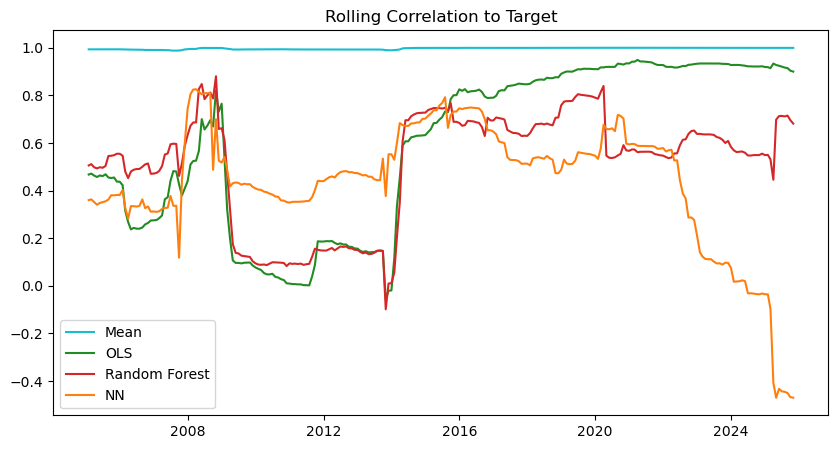
| Mean | OLS | Random Forest | NN | |
|---|---|---|---|---|
| date | ||||
| 1993-03-31 | 1.1% | 0.3% | 0.8% | -0.8% |
| 1993-04-30 | 1.7% | 0.9% | 0.8% | 0.4% |
| 1993-05-31 | 0.2% | 0.7% | 0.8% | 0.2% |
| Mean | OLS | Random Forest | NN | |
|---|---|---|---|---|
| date | ||||
| 2025-08-31 | 0.9% | 0.1% | 0.8% | 0.7% |
| 2025-09-30 | 0.9% | -0.3% | 0.4% | -0.3% |
| 2025-10-31 | 0.9% | -0.2% | -0.1% | -0.1% |
# Output from previous execution

# Output from previous execution
| Passive | Mean | OLS | Random Forest | NN | |
|---|---|---|---|---|---|
| date | |||||
| 1993-03-31 | 2.2% | 2.4% | 0.7% | 0.9% | -0.9% |
| 1993-04-30 | -2.6% | -4.2% | -2.3% | -1.0% | -0.5% |
| 1993-05-31 | 2.7% | 0.7% | 1.8% | 1.1% | 0.3% |
| Passive | Mean | OLS | Random Forest | NN | |
|---|---|---|---|---|---|
| date | |||||
| 2025-08-31 | 2.1% | 1.9% | 0.3% | 0.8% | 0.8% |
| 2025-09-30 | 3.6% | 3.3% | -1.0% | 0.8% | -0.5% |
| 2025-10-31 | 2.4% | 2.2% | -0.6% | -0.1% | -0.1% |
# Output from previous execution
| Mean | OLS | Random Forest | NN | |
|---|---|---|---|---|
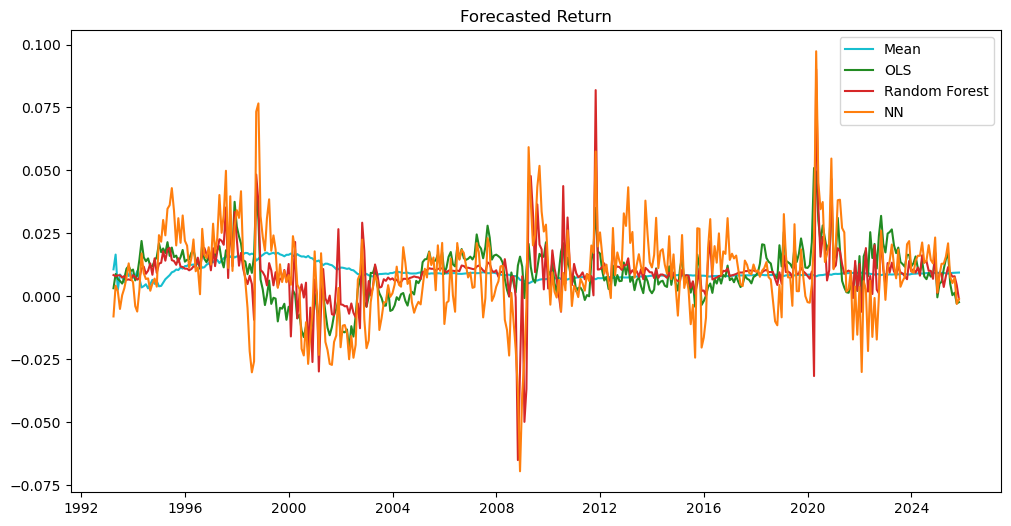
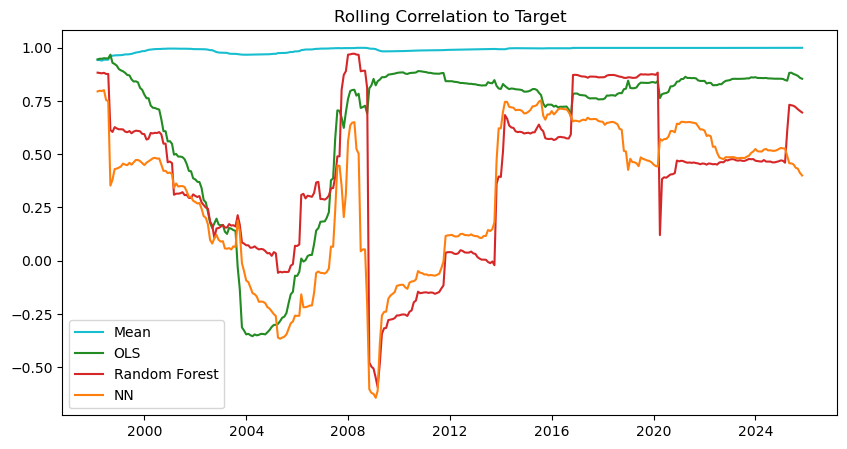
| OOS-Rsquared | 0.0% | 6.6% | 31.9% | 28.4% |
| Corr. between forecast and target | -3.6% | 23.9% | 70.0% | 54.1% |
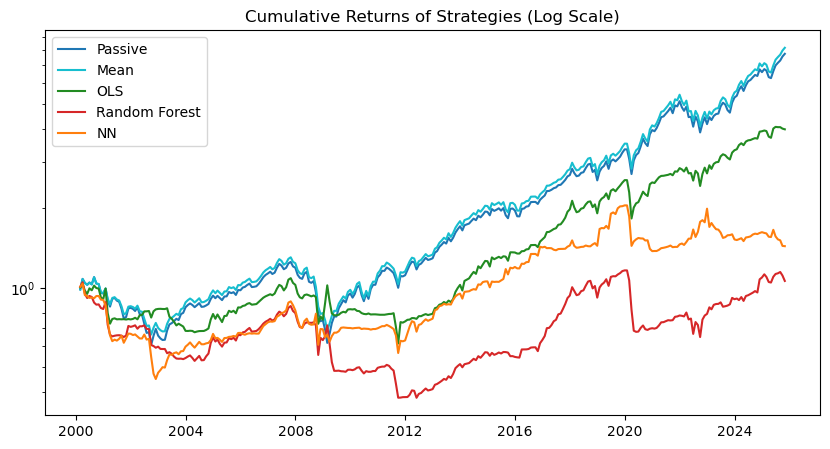
| Mean | Vol | Sharpe | Min | Max | |
|---|---|---|---|---|---|
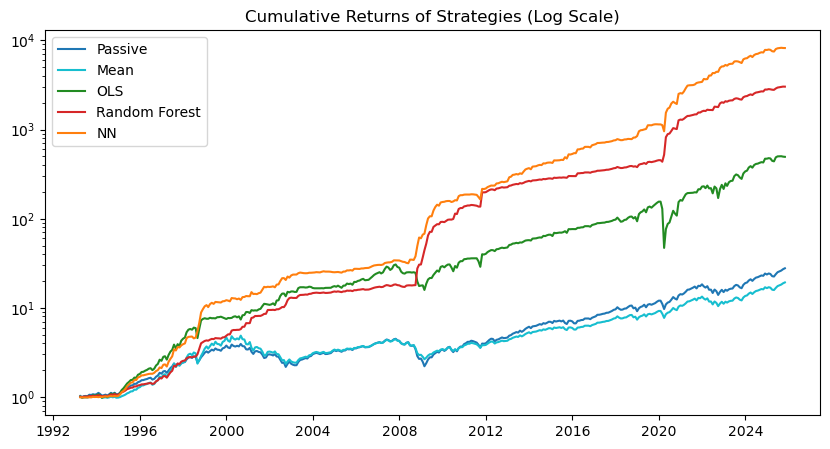
| Passive | 11.3% | 14.8% | 76.6% | -16.5% | 12.7% |
| Mean | 10.2% | 15.0% | 68.2% | -23.3% | 15.3% |
| OLS | 23.1% | 27.4% | 84.4% | -63.5% | 62.5% |
| Random Forest | 26.4% | 20.1% | 131.3% | -4.1% | 57.2% |
| NN | 29.7% | 20.7% | 143.4% | -14.8% | 61.8% |
| Skewness | Kurtosis | VaR (0.05) | CVaR (0.05) | Max Drawdown | Peak | Bottom | Recover | Duration (to Recover) | |
|---|---|---|---|---|---|---|---|---|---|
| Passive | -59.5% | 98.1% | -7.0% | -9.4% | -50.8% | 2007-10-31 | 2009-02-28 | 2012-03-31 | 1613 days |
| Mean | -57.6% | 282.9% | -6.9% | -9.5% | -51.7% | 2000-08-31 | 2002-09-30 | 2013-07-31 | 4717 days |
| OLS | 38.0% | 2312.6% | -6.9% | -14.4% | -69.7% | 2019-12-31 | 2020-03-31 | 2020-12-31 | 366 days |
| Random Forest | 574.9% | 4382.6% | -1.3% | -2.0% | -6.3% | 2007-10-31 | 2008-03-31 | 2008-10-31 | 366 days |
| NN | 416.1% | 2951.5% | -2.4% | -4.3% | -16.6% | 2019-11-30 | 2020-03-31 | 2020-04-30 | 152 days |
| alpha | SPY | r-squared | Treynor Ratio | Info Ratio | |
|---|---|---|---|---|---|
| Passive | -0.00% | 1.00 | 100.00% | 11.32% | |
| Mean | -0.67% | 0.96 | 89.85% | 10.62% | -14.10% |
| OLS | 9.04% | 1.24 | 45.03% | 18.58% | 44.52% |
| Random Forest | 22.54% | 0.34 | 6.38% | 76.72% | 115.67% |
| NN | 24.76% | 0.44 | 9.82% | 67.55% | 125.68% |
# Output from previous execution
OLS
Random Forest
NN
| Mean | OLS | Random Forest | NN | |
|---|---|---|---|---|
| date | ||||
| 1998-03-31 | 1.6% | 1.2% | -1.2% | -4.9% |
| 1998-04-30 | 1.7% | 1.7% | -0.7% | -6.8% |
| 1998-05-31 | 1.7% | 1.0% | 0.3% | -2.5% |
| Mean | OLS | Random Forest | NN | |
|---|---|---|---|---|
| date | ||||
| 2025-08-31 | 0.9% | 0.0% | 0.4% | -0.3% |
| 2025-09-30 | 0.9% | -0.4% | -0.6% | -1.3% |
| 2025-10-31 | 0.9% | -0.3% | -1.6% | -0.1% |
# Output from previous execution
| Mean | OLS | Random Forest | NN | |
|---|---|---|---|---|
| OOS-Rsquared | 0.0% | -6.8% | -17.2% | -69.2% |
| Corr. between forecast and target | -6.9% | 4.7% | -15.2% | -9.7% |
| Mean | Vol | Sharpe | Min | Max | |
|---|---|---|---|---|---|
| Passive | 9.1% | 15.1% | 60.3% | -16.5% | 12.7% |
| Mean | 9.2% | 14.5% | 63.7% | -15.8% | 12.5% |
| OLS | 6.6% | 15.3% | 43.0% | -20.9% | 20.6% |
| Random Forest | 1.5% | 15.5% | 9.6% | -22.8% | 16.5% |
| NN | 2.6% | 15.0% | 17.2% | -23.8% | 15.9% |
| Skewness | Kurtosis | VaR (0.05) | CVaR (0.05) | Max Drawdown | Peak | Bottom | Recover | Duration (to Recover) | |
|---|---|---|---|---|---|---|---|---|---|
| Passive | -50.4% | 79.9% | -7.7% | -9.5% | -50.8% | 2007-10-31 | 2009-02-28 | 2012-03-31 | 1613 days |
| Mean | -47.9% | 71.7% | -6.9% | -8.9% | -47.2% | 2007-10-31 | 2009-02-28 | 2012-08-31 | 1766 days |
| OLS | -59.1% | 654.2% | -5.7% | -11.2% | -43.5% | 2007-10-31 | 2011-09-30 | 2014-05-31 | 2404 days |
| Random Forest | -132.2% | 704.1% | -7.3% | -13.2% | -63.6% | 2000-03-31 | 2012-05-31 | 2018-08-31 | 6727 days |
| NN | -112.0% | 757.2% | -6.1% | -11.8% | -56.6% | 2000-03-31 | 2002-11-30 | 2014-10-31 | 5327 days |
| alpha | SPY | r-squared | Treynor Ratio | Info Ratio | |
|---|---|---|---|---|---|
| Passive | 0.00% | 1.00 | 100.00% | 9.13% | |
| Mean | 0.54% | 0.95 | 98.90% | 9.70% | 35.70% |
| OLS | 1.27% | 0.58 | 33.10% | 11.31% | 10.12% |
| Random Forest | -2.94% | 0.48 | 22.47% | 3.06% | -21.59% |
| NN | -0.44% | 0.33 | 11.14% | 7.80% | -3.11% |