Solution - VaR#
# Output from previous execution
| AAPL | META | NVDA | TSLA | portfolio | portfolio-ex TSLA | stand-alone TSLA | |
|---|---|---|---|---|---|---|---|
| vol | 60.90% | 77.34% | 101.99% | 129.10% | 69.46% | 64.31% | 32.27% |
| VaR 0.05 | -5.64% | -7.00% | -8.69% | -11.74% | -6.19% | -5.58% | -2.93% |
| CVaR 0.05 | -8.31% | -10.32% | -11.65% | -14.78% | -8.50% | -8.06% | -3.70% |
# Output from previous execution
# Output from previous execution
# Output from previous execution
# Output from previous execution
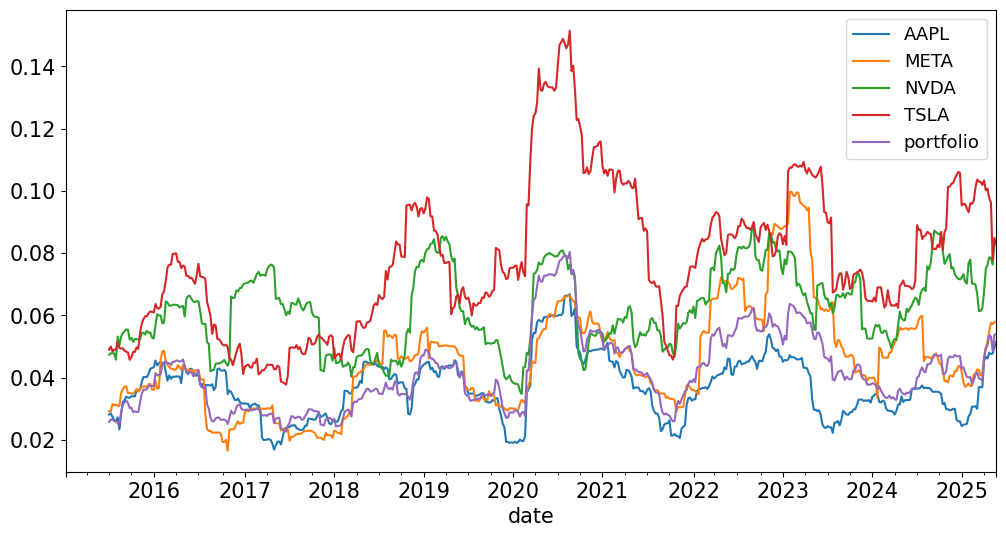
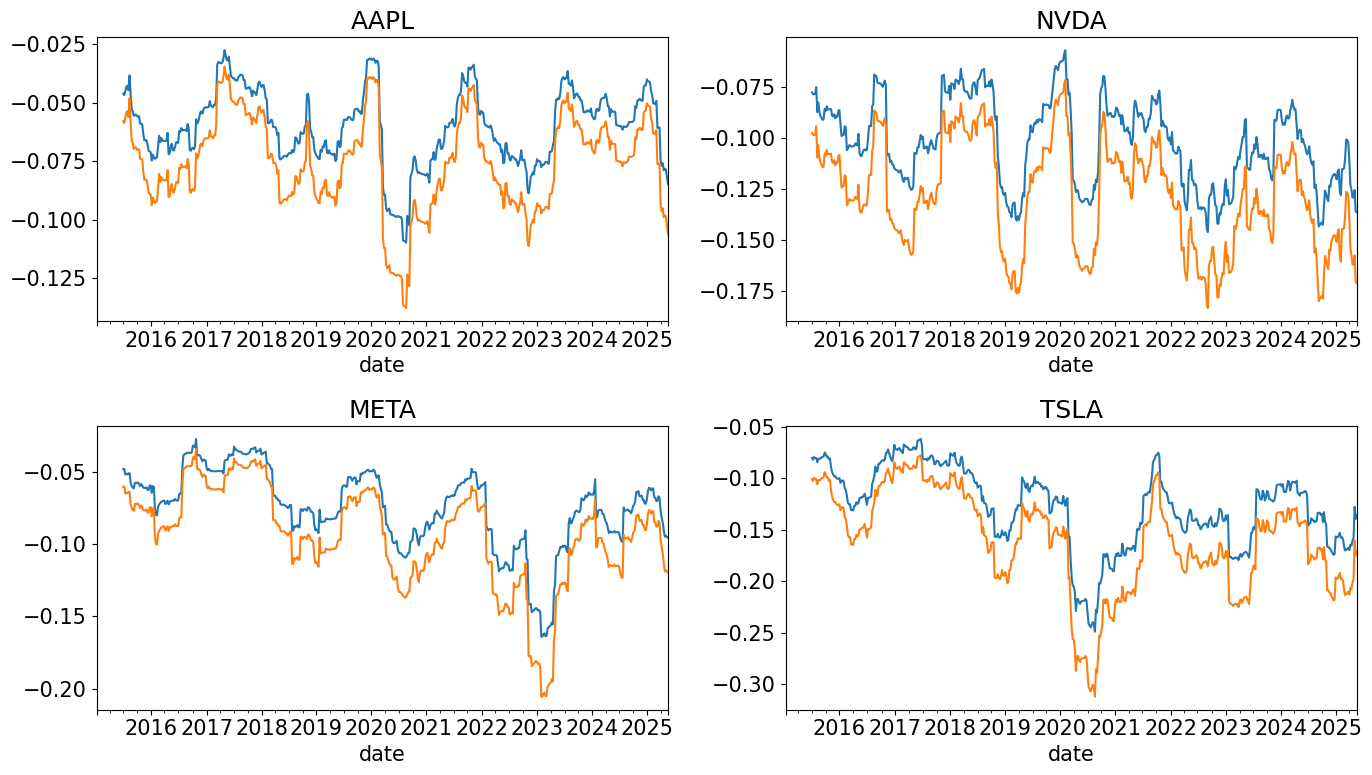
| VaR | CVaR | |||
|---|---|---|---|---|
| unconditional | conditional | unconditional | conditional | |
| AAPL | -5.6% | -8.5% | -8.3% | -10.6% |
| META | -7.0% | -9.5% | -10.3% | -12.0% |
| NVDA | -8.7% | -13.6% | -11.6% | -17.1% |
| TSLA | -11.7% | -13.7% | -14.8% | -17.1% |
| portfolio | -6.2% | -8.9% | -8.5% | -11.1% |
# Output from previous execution
| Hit Ratio | |
|---|---|
| AAPL | 4.98% |
| META | 4.24% |
| NVDA | 4.24% |
| TSLA | 4.98% |
| portfolio | 4.06% |