Solution - Constrained Optimization#
# Output from previous execution
| name | gics_sector_name | mkt cap | |
|---|---|---|---|
| ticker | |||
| AAPL | Apple Inc | Information Technology | 4.025226e+12 |
| NVDA | NVIDIA Corp | Information Technology | 4.621131e+12 |
| MSFT | Microsoft Corp | Information Technology | 3.791850e+12 |
| GOOGL | Alphabet Inc | Communication Services | 3.338761e+12 |
| AMZN | Amazon.com Inc | Consumer Discretionary | 2.508887e+12 |
| META | Meta Platforms Inc | Communication Services | 1.536490e+12 |
| TSLA | Tesla Inc | Consumer Discretionary | 1.344795e+12 |
| AVGO | Broadcom Inc | Information Technology | 1.617221e+12 |
| BRK/B | Berkshire Hathaway Inc | Financials | 1.101107e+12 |
| LLY | Eli Lilly & Co | Health Care | 9.692831e+11 |
# Output from previous execution
| Mean | Vol | Sharpe | |
|---|---|---|---|
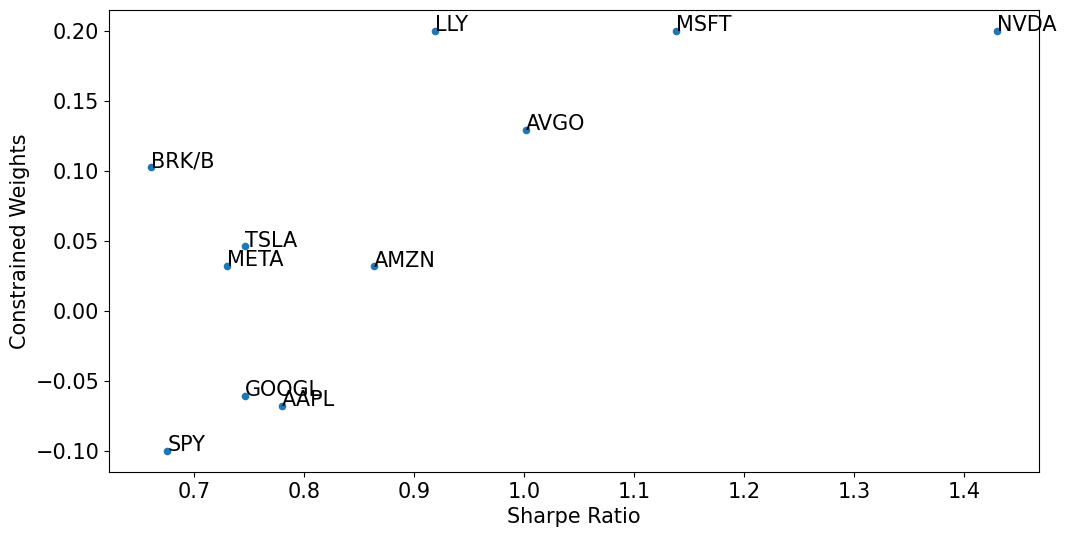
| NVDA | 66.72% | 46.67% | 142.96% |
| MSFT | 26.51% | 23.30% | 113.79% |
| AVGO | 37.65% | 37.60% | 100.13% |
| LLY | 26.24% | 28.57% | 91.86% |
| AMZN | 26.05% | 30.19% | 86.30% |
| AAPL | 21.75% | 27.89% | 77.98% |
| TSLA | 44.44% | 59.57% | 74.60% |
| GOOGL | 21.07% | 28.26% | 74.58% |
| META | 26.01% | 35.65% | 72.94% |
| SPY | 10.13% | 15.00% | 67.55% |
| BRK/B | 12.74% | 19.27% | 66.11% |
# Output from previous execution
# Output from previous execution
Optimization SUCCESSFUL.
Iterations: 20.
# Output from previous execution
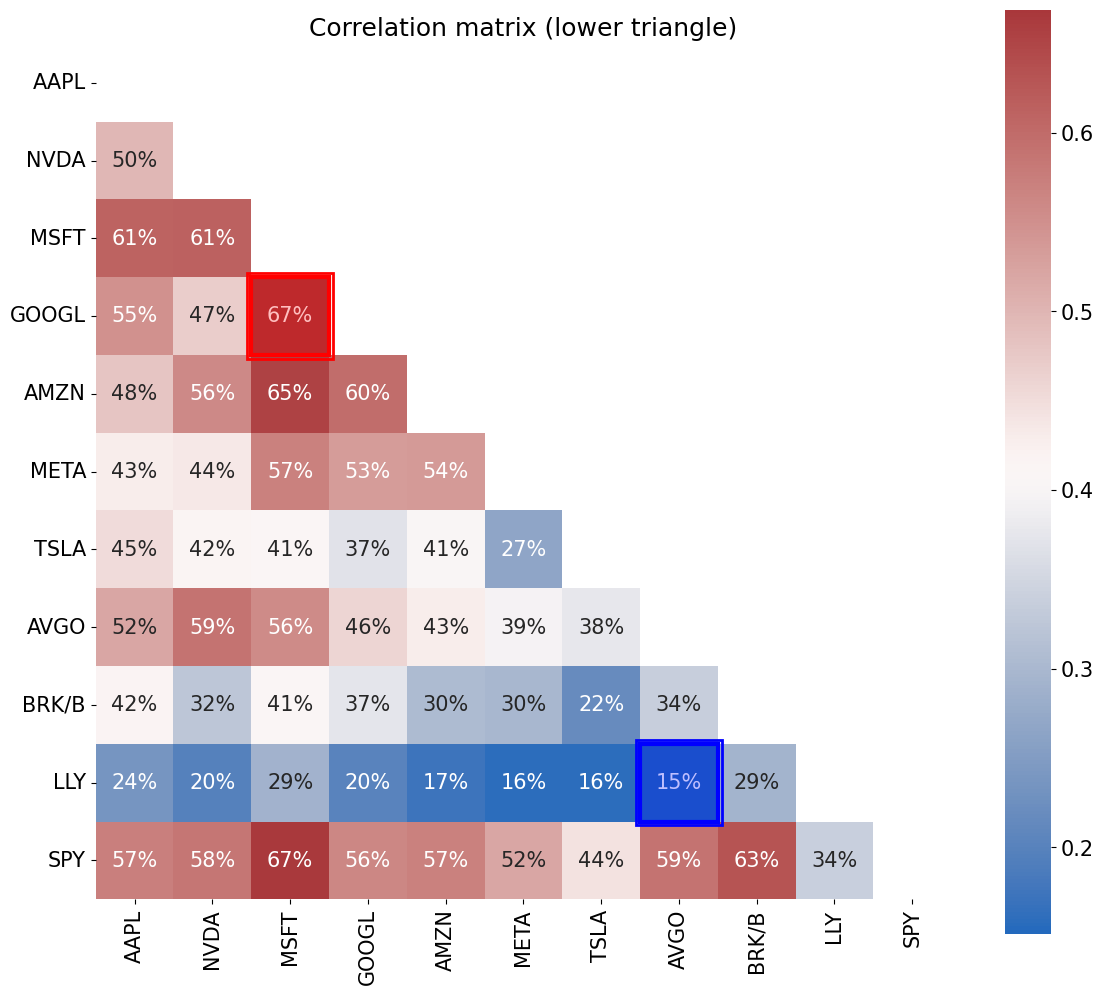
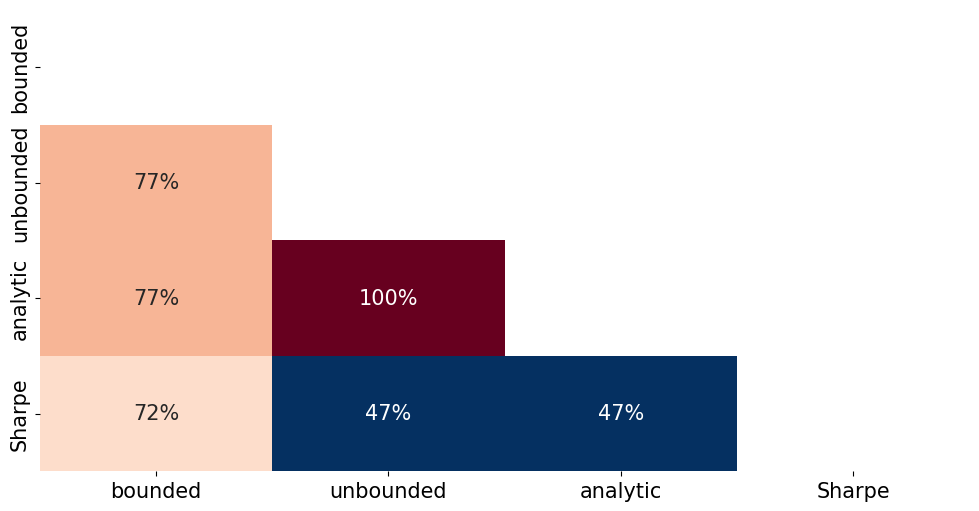
'Correlation between BOUNDED and UNBOUNDED weights is: 77.2%'
# Output from previous execution
# Output from previous execution
| mean | vol | sharpe | |
|---|---|---|---|
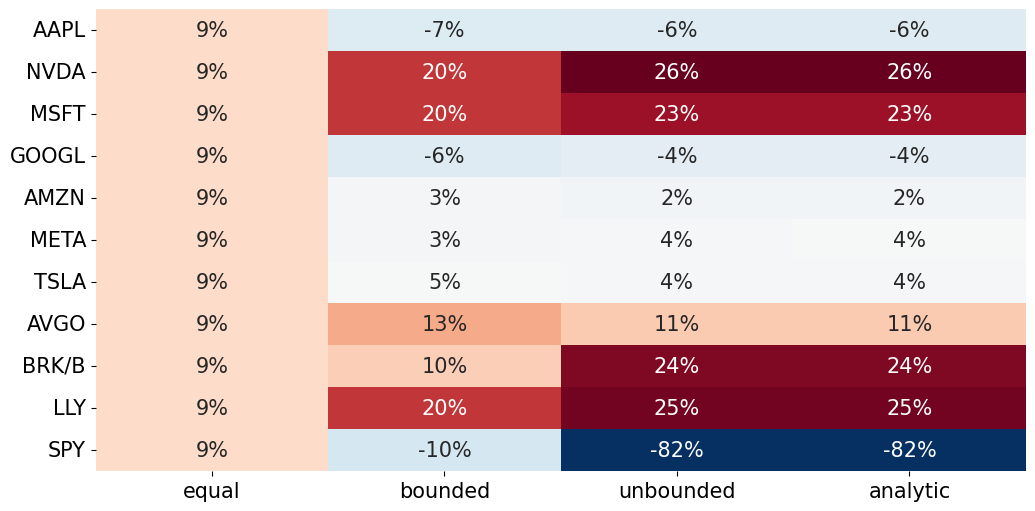
| equal | 29.03% | 22.09% | 131.38% |
| bounded | 30.00% | 18.81% | 159.49% |
| unbounded | 30.00% | 17.18% | 174.66% |
| analytic | 30.00% | 17.18% | 174.66% |
# Output from previous execution
# Output from previous execution
# Output from previous execution
| Lagrange Multipliers | |
|---|---|
| NVDA | 3.01% |
| LLY | 1.65% |
| MSFT | 0.45% |
| BRK/B | 0.00% |
| AVGO | 0.00% |
| META | 0.00% |
| GOOGL | -0.00% |
| AAPL | -0.00% |
| AMZN | -0.00% |
| TSLA | -0.00% |
| SPY | -1.25% |