Solution - Unconstrained Optimization#
# Output from previous execution
| name | mkt cap (billions $) | |
|---|---|---|
| ticker | ||
| AAPL | Apple Inc | 3,009 |
| NVDA | NVIDIA Corp | 3,480 |
| MSFT | Microsoft Corp | 3,514 |
| GOOGL | Alphabet Inc | 2,146 |
| AMZN | Amazon.com Inc | 2,304 |
| META | Meta Platforms Inc | 1,745 |
| TSLA | Tesla Inc | 994 |
| AVGO | Broadcom Inc | 1,149 |
| BRK/B | Berkshire Hathaway Inc | 1,064 |
| LLY | Eli Lilly & Co | 733 |
# Output from previous execution
| Mean | Vol | Sharpe | Min | Max | skewness | kurtosis | max drawdown | |
|---|---|---|---|---|---|---|---|---|
| AAPL | 23.9% | 27.7% | 86.3% | -17.5% | 14.7% | -21.9% | 182.6% | -34.6% |
| NVDA | 64.6% | 46.3% | 139.3% | -20.1% | 30.2% | 34.5% | 138.9% | -65.9% |
| MSFT | 26.1% | 24.0% | 108.9% | -14.4% | 15.0% | 7.2% | 234.2% | -35.1% |
| GOOGL | 21.7% | 28.0% | 77.5% | -12.0% | 25.8% | 58.3% | 372.1% | -41.9% |
| AMZN | 29.3% | 30.6% | 95.9% | -14.5% | 18.5% | 6.3% | 178.2% | -54.8% |
| META | 26.2% | 35.1% | 74.6% | -23.7% | 24.5% | 5.2% | 402.4% | -76.0% |
| TSLA | 47.0% | 58.6% | 80.1% | -25.9% | 33.3% | 54.8% | 159.4% | -72.2% |
| AVGO | 39.5% | 37.5% | 105.3% | -18.3% | 25.2% | 66.2% | 350.4% | -40.0% |
| BRK/B | 13.5% | 19.1% | 70.8% | -13.4% | 9.8% | -20.1% | 251.3% | -26.5% |
| LLY | 28.2% | 28.3% | 99.5% | -12.2% | 17.5% | 21.6% | 168.3% | -25.3% |
| SPY | 13.1% | 17.1% | 76.8% | -14.5% | 12.1% | -57.9% | 599.6% | -31.8% |
# Output from previous execution
| alpha | SPY | r-squared | Treynor Ratio | Info Ratio | |
|---|---|---|---|---|---|
| AAPL | 9.3% | 111.3% | 47.3% | 21.4% | 46.1% |
| NVDA | 41.8% | 173.5% | 41.0% | 37.2% | 117.4% |
| MSFT | 12.6% | 103.2% | 54.0% | 25.3% | 77.4% |
| GOOGL | 7.7% | 106.6% | 42.4% | 20.3% | 36.2% |
| AMZN | 15.3% | 106.6% | 35.5% | 27.5% | 62.4% |
| META | 11.1% | 114.8% | 31.2% | 22.8% | 38.2% |
| TSLA | 23.8% | 176.2% | 26.4% | 26.7% | 47.4% |
| AVGO | 21.7% | 135.7% | 38.2% | 29.1% | 73.5% |
| BRK/B | 2.8% | 81.7% | 53.6% | 16.5% | 21.4% |
| LLY | 19.9% | 62.7% | 14.3% | 44.9% | 76.1% |
| SPY | 0.0% | 100.0% | 100.0% | 13.1% | - |
# Output from previous execution
| alpha | SPY | NVDA | r-squared | Info Ratio | |
|---|---|---|---|---|---|
| AAPL | 7.1% | 102.2% | 5.3% | 47.7% | 35.3% |
# Output from previous execution
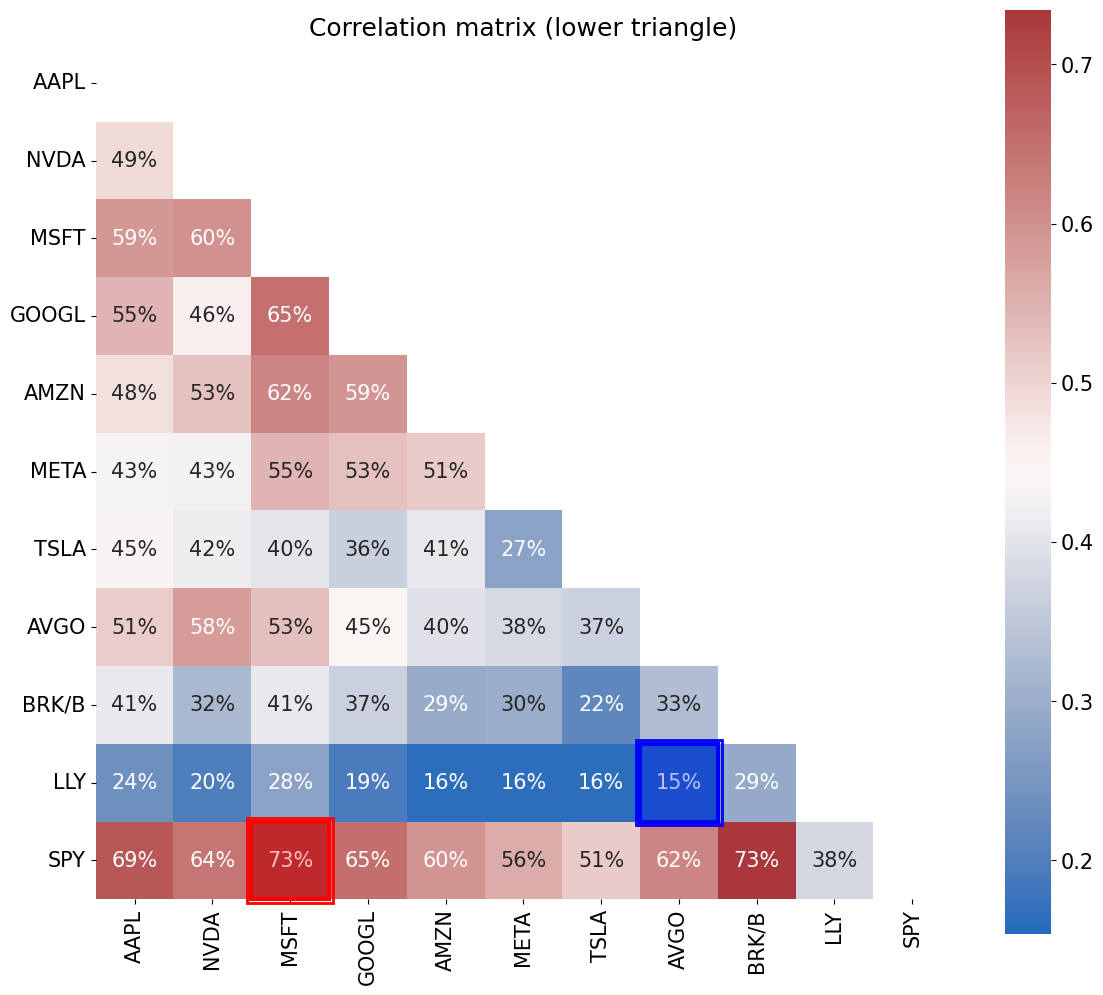
(<Figure size 1200x1200 with 2 Axes>,
 <Axes: title={'center': 'Correlation matrix (lower triangle)'}>)
# Output from previous execution
# Output from previous execution
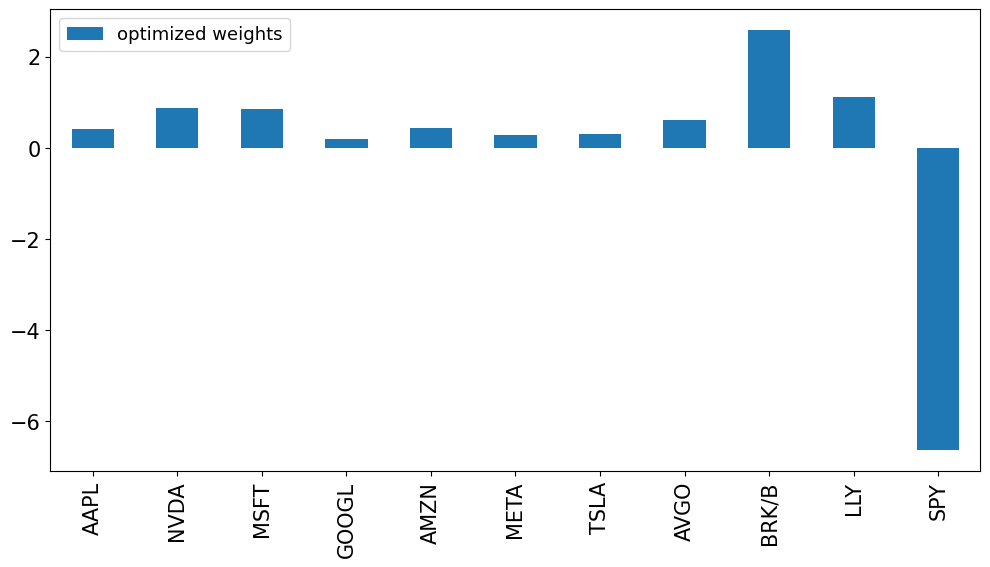
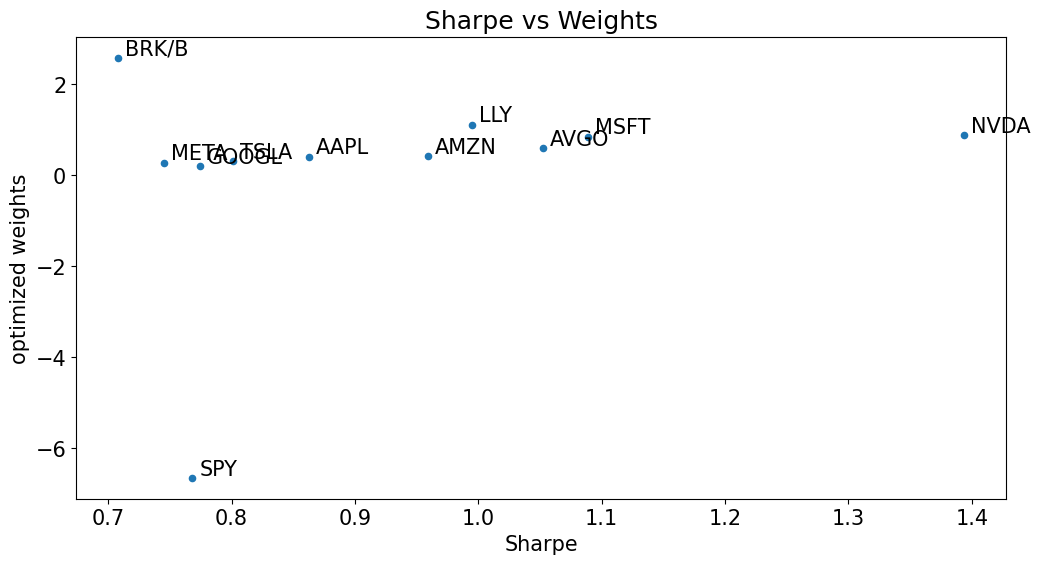
| optimized weights | Sharpe | |
|---|---|---|
| BRK/B | 258.0% | 70.8% |
| LLY | 111.3% | 99.5% |
| NVDA | 88.3% | 139.3% |
| MSFT | 84.9% | 108.9% |
| AVGO | 60.2% | 105.3% |
| AMZN | 42.6% | 95.9% |
| AAPL | 40.9% | 86.3% |
| TSLA | 31.0% | 80.1% |
| META | 27.7% | 74.6% |
| GOOGL | 19.3% | 77.5% |
| SPY | -664.3% | 76.8% |
# Output from previous execution
# Output from previous execution
| Mean | Vol | Sharpe | Min | Max | |
|---|---|---|---|---|---|
| optimized weights | 130.22% | 62.95% | 206.85% | -27.41% | 32.35% |
# Output from previous execution
# Output from previous execution
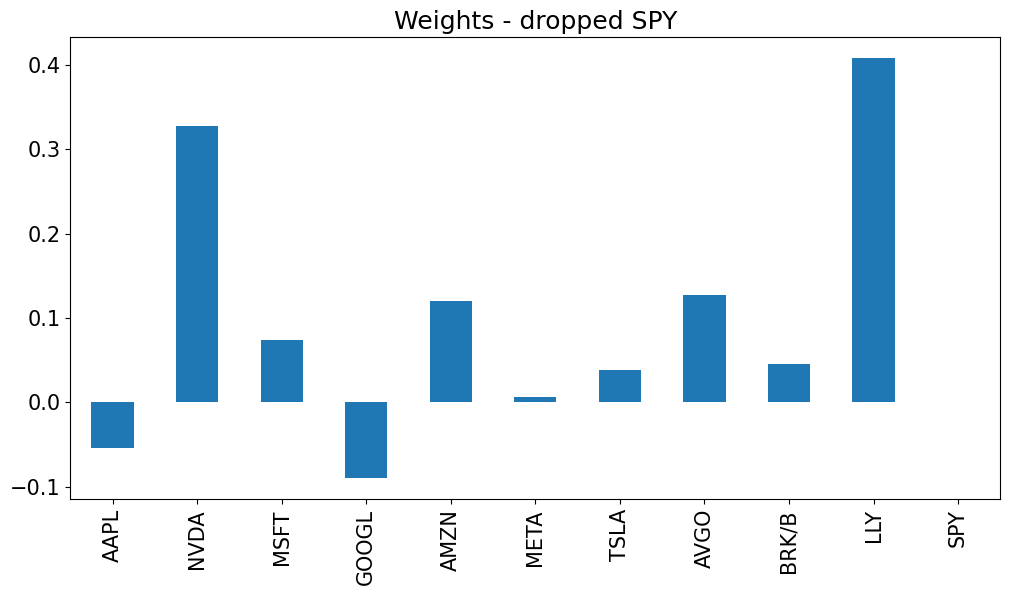
| Mean | Vol | Sharpe | Min | Max | |
|---|---|---|---|---|---|
| optimized weights | 130.2% | 63.0% | 206.9% | -27.4% | 32.3% |
| optimized ex SPY | 42.4% | 26.2% | 161.6% | -11.9% | 15.2% |
# Output from previous execution
| gross mkt weight | |
|---|---|
| optimized weights | 1,428.6% |
| optimized ex SPY | 128.9% |