Solution - ProShares Replication#
HBS Case#
ProShares Hedge Replication ETF#
# Output from previous execution
| mean | vol | sharpe | |
|---|---|---|---|
| HFRIFWI Index | 5.1% | 5.9% | 87.2% |
| MLEIFCTR Index | 3.9% | 5.5% | 69.8% |
| MLEIFCTX Index | 3.7% | 5.5% | 66.3% |
| HDG US Equity | 2.7% | 5.7% | 46.8% |
| QAI US Equity | 2.9% | 5.0% | 57.8% |
# Output from previous execution
| skewness | excess_kurtosis | VaR_0.05 | CVaR_0.05 | max_drawdown | dd_peak | dd_trough | dd_recovery | |
|---|---|---|---|---|---|---|---|---|
| HFRIFWI Index | -94.8% | 565.7% | -2.4% | -3.6% | -11.5% | 2019-12-31 | 2020-03-31 | 2020-08-31 |
| MLEIFCTR Index | -29.0% | 163.1% | -2.7% | -3.5% | -12.4% | 2021-06-30 | 2022-09-30 | 2024-02-29 |
| MLEIFCTX Index | -27.3% | 159.0% | -2.7% | -3.5% | -12.4% | 2021-06-30 | 2022-09-30 | 2024-02-29 |
| HDG US Equity | -27.5% | 177.6% | -3.0% | -3.7% | -14.1% | 2021-06-30 | 2022-09-30 | 2024-07-31 |
| QAI US Equity | -43.4% | 144.9% | -1.7% | -3.1% | -13.8% | 2021-06-30 | 2022-09-30 | 2024-02-29 |
# Output from previous execution
| beta | treynor | ir | |
|---|---|---|---|
| HFRIFWI Index | 34.6% | 14.8% | 5.5% |
| MLEIFCTR Index | 34.2% | 11.0% | -44.7% |
| MLEIFCTX Index | 34.1% | 10.4% | -52.0% |
| HDG US Equity | 35.0% | 7.4% | -87.0% |
| QAI US Equity | 30.1% | 9.2% | -61.9% |
# Output from previous execution
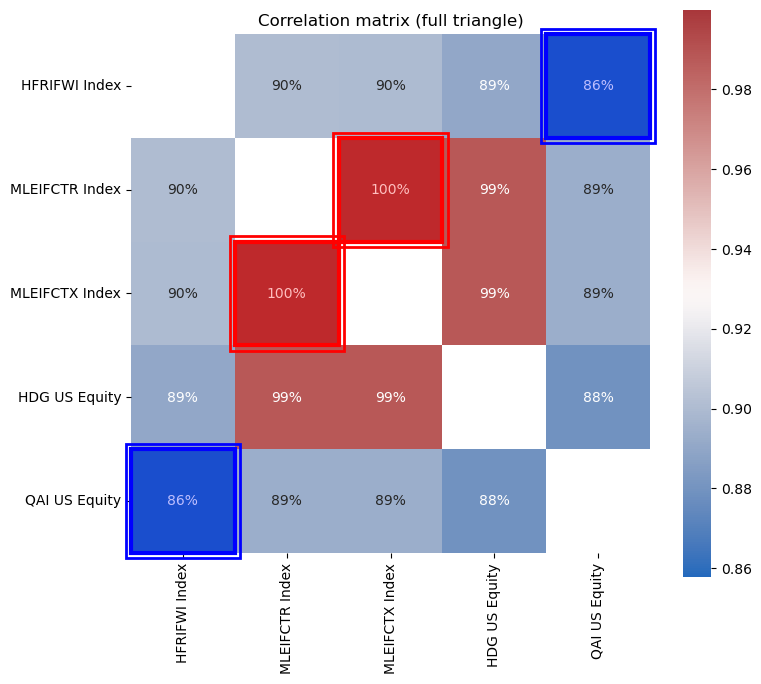
(<Figure size 800x800 with 2 Axes>,
 <Axes: title={'center': 'Correlation matrix (full triangle)'}>)
# Output from previous execution
Intercept (alpha): 0.001149
| beta | |
|---|---|
| SPY US Equity | 4.4% |
| IWM US Equity | 14.6% |
| EFA US Equity | 7.4% |
| EEM US Equity | 8.6% |
| EUO US Equity | 3.0% |
| USGG3M Index | 32.5% |
# Output from previous execution
Position intensity: Sum of absolute betas (ex-alpha): 0.703
# Output from previous execution
c. R-squared: 0.84
# Output from previous execution
d. Tracking Error (annualized): 0.0233
# Output from previous execution
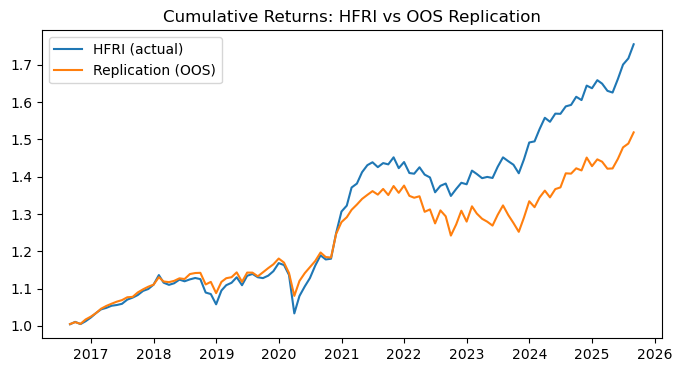
OOS correlation (HFRI vs replication):  0.9013
OOS tracking error (Vol - annualized):  0.0275
# Output from previous execution
The OOS R-Squared of the replication is 0.8055
# Output from previous execution
# Output from previous execution
| with_const | no_const | |
|---|---|---|
| alpha | 0.1% | 0.0% |
| beta_mkt | 4.4% | 5.5% |
| r2 | 84.3% | 85.0% |
| te_ann | 2.3% | 2.3% |
| mean_fitted | 0.4% | 0.4% |
| mean_actual | 0.4% | 0.4% |
| corr | 91.8% | 91.7% |
| beta_abs_sum | 70.3% | 103.5% |
| beta_with_const | |
|---|---|
| SPY US Equity | 4.4% |
| IWM US Equity | 14.6% |
| EFA US Equity | 7.4% |
| EEM US Equity | 8.6% |
| EUO US Equity | 3.0% |
| USGG3M Index | 32.5% |
| beta_no_const | |
|---|---|
| SPY US Equity | 5.5% |
| IWM US Equity | 14.3% |
| EFA US Equity | 7.1% |
| EEM US Equity | 8.4% |
| EUO US Equity | 3.2% |
| USGG3M Index | 65.0% |
# Output from previous execution
| mean_fitted | |
|---|---|
| with_const | 0.4% |
| no_const | 0.4% |
| mean_actual | |
|---|---|
| with_const | 0.4% |
| no_const | 0.4% |
# Output from previous execution
| corr | |
|---|---|
| with_const | 91.8% |
| no_const | 91.7% |
# Output from previous execution
| beta_nnls | |
|---|---|
| intercept | 0.1% |
| SPY US Equity | 4.4% |
| IWM US Equity | 14.6% |
| EFA US Equity | 7.4% |
| EEM US Equity | 8.6% |
| EUO US Equity | 3.0% |
| USGG3M Index | 32.5% |
Correlation: 0.917984
R-squared: 0.8427
Tracking Error: 0.0233
# Output from previous execution
| beta_bounded | |
|---|---|
| intercept | 0.1% |
| SPY US Equity | 4.4% |
| IWM US Equity | 14.6% |
| EFA US Equity | 7.4% |
| EEM US Equity | 8.6% |
| EUO US Equity | 3.0% |
| USGG3M Index | 32.5% |
Correlation: 0.917984
R-squared: 0.8427
Tracking Error: 0.0233
# Output from previous execution
| beta_qp | |
|---|---|
| SPY US Equity | 7.6% |
| IWM US Equity | 13.2% |
| EFA US Equity | 6.8% |
| EEM US Equity | 8.6% |
| EUO US Equity | 3.5% |
| USGG3M Index | 0.9% |
0.8404 0.0235
Correlation: 0.917984
R-squared: 0.8404
Tracking Error: 0.0235
# Output from previous execution
| beta | |
|---|---|
| SPY US Equity | 6.5% |
| IWM US Equity | -1.3% |
| EFA US Equity | 90.6% |
| EEM US Equity | -3.9% |
| EUO US Equity | 34.6% |
| USGG3M Index | 7.0% |
alpha: 0.000754
R-squared: 0.9618
Tracking Error: 0.0235
# Output from previous execution
| beta | |
|---|---|
| SPY US Equity | 199.0% |
| IWM US Equity | -22.0% |
| EFA US Equity | -13.5% |
| EEM US Equity | -9.7% |
| EUO US Equity | -8.3% |
| USGG3M Index | 68.2% |
alpha: -0.001894
R-squared: 0.7125
Tracking Error: 0.1429
# Output from previous execution
| mean | vol | sharpe | |
|---|---|---|---|
| TAIL US Equity | -6.4% | 11.4% | -56.3% |
| SPY US Equity | 14.5% | 14.3% | 100.9% |
| skewness | excess_kurtosis | VaR_0.05 | CVaR_0.05 | max_drawdown | dd_peak | dd_trough | dd_recovery | |
|---|---|---|---|---|---|---|---|---|
| TAIL US Equity | 106.0% | 303.3% | -4.6% | -6.3% | -49.5% | 2017-05-31 00:00:00 | 2025-01-31 00:00:00 | NaT |
| SPY US Equity | -41.3% | 70.4% | -6.3% | -8.4% | -23.9% | 2021-12-31 00:00:00 | 2022-09-30 00:00:00 | 2023-12-31 00:00:00 |
| TAIL US Equity | |
|---|---|
| alpha | 0.1% |
| beta | -49.5% |
| r2 | 48.5% |
| treynor | 13.0% |
| ir | 13.5% |
# Output from previous execution
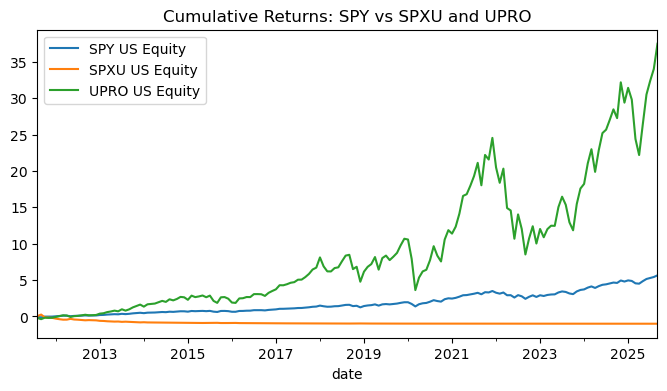
| mean | vol | sharpe | |
|---|---|---|---|
| SPXU US Equity | -44.4% | 39.7% | -111.8% |
| UPRO US Equity | 36.3% | 44.5% | 81.6% |
| SPY US Equity | 14.5% | 14.3% | 100.9% |
# Output from previous execution
| skewness | excess_kurtosis | VaR_0.05 | CVaR_0.05 | max_drawdown | dd_peak | dd_trough | dd_recovery | |
|---|---|---|---|---|---|---|---|---|
| SPXU US Equity | 59.4% | 84.3% | -18.9% | -25.2% | -100.0% | 2011-09-30 | 2025-09-30 | |
| UPRO US Equity | -45.4% | 121.4% | -19.9% | -26.4% | -62.7% | 2021-12-31 | 2022-09-30 | 2024-06-30 |
| SPY US Equity | -41.3% | 70.4% | -6.3% | -8.4% | -23.9% | 2021-12-31 | 2022-09-30 | 2023-12-31 |
# Output from previous execution
| alpha | beta | r2 | treynor | ir | |
|---|---|---|---|---|---|
| SPXU US Equity | -0.5% | -264.5% | 91.2% | 16.8% | -51.8% |
| UPRO US Equity | -0.7% | 309.0% | 99.2% | 11.7% | -214.5% |
# Output from previous execution