GMO Performance#
Case: Grantham, Mayo, and Van Otterloo, 2012: Estimating the Equity Risk Premium [9-211-051].
# Output from previous execution
| Name | Company Description | Fund Total Assets | Dividend Yield | |
|---|---|---|---|---|
| Ticker | ||||
| GMWAX | GMO Global Asset Allocation Fu | GMO Global Asset Allocation Fund seeks total return greater than that of it... | $466 | 4.24% |
| GBMFX | GMO Benchmark-Free Allocation | GMO Benchmark-Free Allocation Fund seeks a positive return by investing in ... | $2,427 | 4.31% |
| GQETX | GMO Quality Fund | GMO Quality Fund seeks total return by investing in equities believed to be... | $11,914 | 6.48% |
| GMGEX | GMO Global Equity Allocation F | GMO Global Equity Allocation Fund seeks a total return greater than its ben... | $610 | 4.30% |
| SPY | SPDR S&P 500 ETF Trust | SPDR S&P 500 ETF Trust is an exchange-traded fund incorporated in the USA. ... | $693,035 | 1.08% |
| EFA | iShares MSCI EAFE ETF | iShares MSCI EAFE ETF is an exchange-traded fund incorporated in the USA. T... | $68,792 | 2.71% |
| IJR | iShares Core S&P Small-Cap ETF | iShares Core S&P Small-Cap ETF is an exchange-traded fund incorporated in t... | $84,951 | 1.97% |
| GWX | SPDR S&P International Small C | SPDR S&P International Small Cap ETF is an exchange-traded fund incorporate... | $774 | 2.22% |
| EEM | iShares MSCI Emerging Markets | iShares MSCI Emerging Markets ETF is an exchange-traded fund incorporated i... | $20,902 | 2.14% |
| IYR | iShares U.S. Real Estate ETF | iShares U.S. Real Estate ETF is an exchange-traded fund incorporated in the... | $3,805 | 2.39% |
| TLT | iShares 20+ Year Treasury Bond | iShares 20+ Year Treasury Bond ETF is an exchange-traded fund incorporated ... | $50,014 | 4.34% |
| TIP | iShares TIPS Bond ETF | iShares TIPS ETF is an exchange-traded fund incorporated in the USA. The ET... | $14,350 | 3.15% |
| BWX | SPDR Bloomberg International T | SPDR Bloomberg International Treasury Bond ETF is an exchange-traded fund i... | $1,332 | 2.05% |
| EMB | iShares J.P. Morgan USD Emergi | iShares J.P. Morgan USD Emerging Markets Bond ETF is an exchange-traded fun... | $15,087 | 5.31% |
| GLD | SPDR Gold Shares | SPDR Gold Shares is an investment fund incorporated in the USA. The invest... | $141,430 | |
| DBC | Invesco DB Commodity Index Tra | Invesco DB Commodity Index Tracking Fund is an exchange traded fund incorpo... | $1,298 | 4.84% |
| FXE | Invesco CurrencyShares Euro Cu | Invesco CurrencyShares Euro Trust is an exchange-traded fund incorporated i... | $430 | 1.02% |
| MXWD | MSCI ACWI Index | The MSCI ACWI Index is a free-float weighted equity index. It was developed... | 1.68% | |
| LBUSTRUU | Bloomberg US Agg Total Return | The Bloomberg USAgg Index is a broad-based flagship benchmark that measures... | ||
| USGG3M | US Generic Govt 3 Mth |
# Output from previous execution
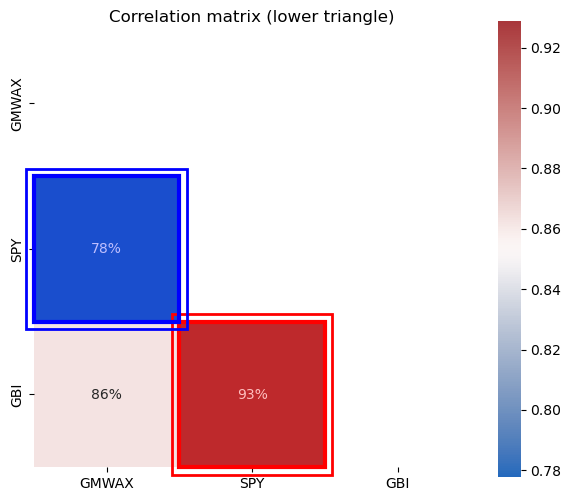
| Mean | Vol | Sharpe | Min | Max | 5th Percentile | Max Drawdown | |
|---|---|---|---|---|---|---|---|
| GMWAX | 4.9% | 10.4% | 46.7% | -10.5% | 7.6% | -2.2% | -31.7% |
| SPY | 9.0% | 17.7% | 51.1% | -19.8% | 13.3% | -3.7% | -59.8% |
| GBI | 5.3% | 11.0% | 48.0% | -13.7% | 8.5% | -2.2% | -40.9% |
# Output from previous execution
# Output from previous execution
| alpha | SPY | GBI | r-squared | Treynor Ratio | Info Ratio | |
|---|---|---|---|---|---|---|
| GMWAX | 0.8% | 45.5% | 60.5% | 10.7% | 12.4% | |
| GMWAX | 0.5% | 81.3% | 74.4% | 6.0% | 9.6% |
# Output from previous execution
| Mean | Vol | Sharpe | Min | Max | 5th Percentile | Max Drawdown | |
|---|---|---|---|---|---|---|---|
| 0 | 2.9% | 15.7% | 18.6% | -16.5% | 10.5% | -3.5% | -58.3% |
# Output from previous execution
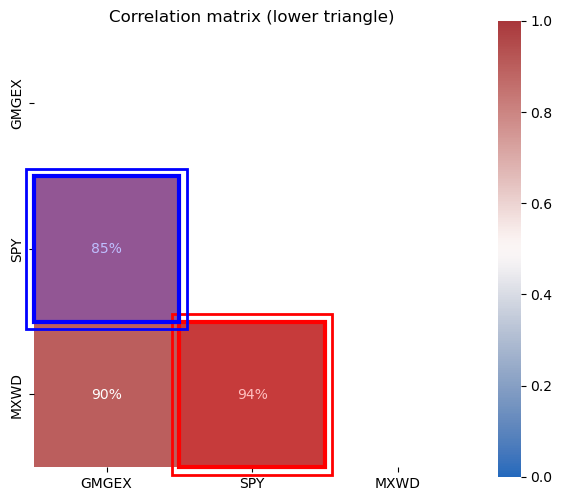
| Mean | Vol | Sharpe | Min | Max | 5th Percentile | Max Drawdown | |
|---|---|---|---|---|---|---|---|
| GMGEX | 2.9% | 15.7% | 18.6% | -16.5% | 10.5% | -3.5% | -58.3% |
| SPY | 9.0% | 17.7% | 51.1% | -19.8% | 13.3% | -3.7% | -59.8% |
| MXWD | 7.1% | 16.7% | 42.4% | -20.0% | 12.4% | -3.4% | -58.0% |
# Output from previous execution
(<Figure size 600x600 with 2 Axes>,
 <Axes: title={'center': 'Correlation matrix (lower triangle)'}>)
# Output from previous execution
| alpha | SPY | r-squared | Treynor Ratio | Info Ratio | MXWD | |
|---|---|---|---|---|---|---|
| GMGEX | -3.5% | 74.4% | 71.6% | 3.9% | -42.3% | |
| GMGEX | -3.0% | 81.1% | 3.5% | -43.3% | 83.7% |
# Output from previous execution
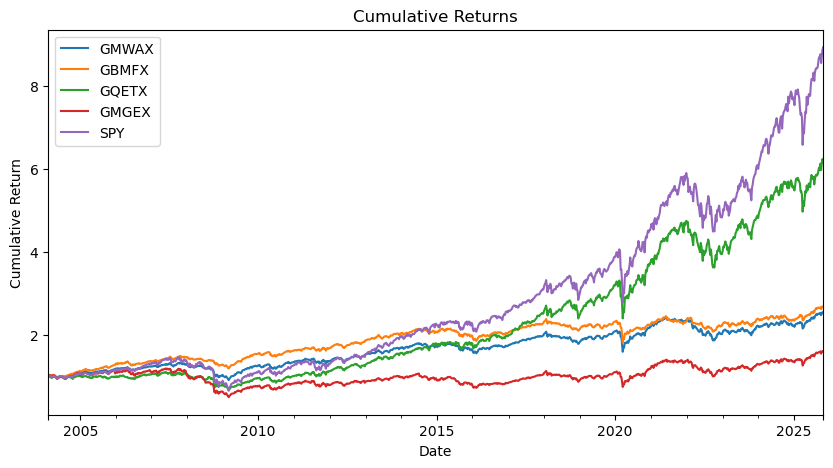
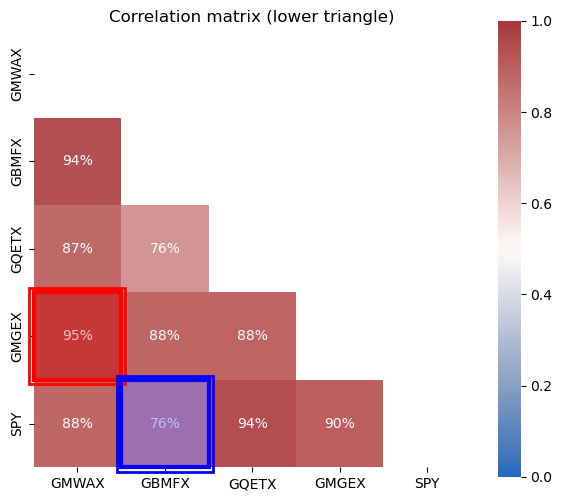
| Mean | Vol | Sharpe | Min | Max | |
|---|---|---|---|---|---|
| GMWAX | 4.7% | 9.8% | 48.7% | -10.5% | 7.6% |
| GBMFX | 4.8% | 7.9% | 61.3% | -9.6% | 6.8% |
| GQETX | 9.5% | 14.8% | 63.8% | -17.1% | 11.8% |
| GMGEX | 3.5% | 16.3% | 21.5% | -16.5% | 10.5% |
| SPY | 11.6% | 17.4% | 66.5% | -19.8% | 13.3% |
# Output from previous execution
# Output from previous execution
(<Figure size 600x600 with 2 Axes>,
 <Axes: title={'center': 'Correlation matrix (lower triangle)'}>)
# Output from previous execution
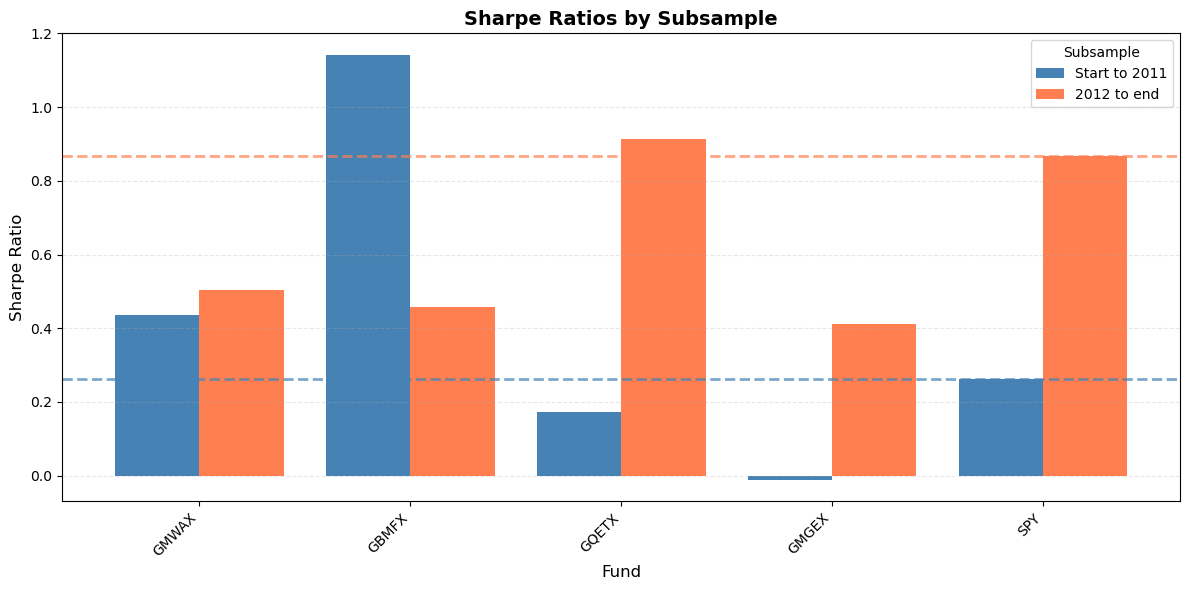
Start to 2011
| Mean | Vol | Sharpe | Min | Max | 5th Percentile | Max Drawdown | |
|---|---|---|---|---|---|---|---|
| GMWAX | 4.8% | 11.0% | 43.7% | -8.7% | 6.5% | -2.4% | -31.7% |
| GBMFX | 8.8% | 7.7% | 114.3% | -3.9% | 3.3% | -1.7% | -20.4% |
| GQETX | 2.6% | 15.1% | 17.3% | -17.1% | 7.6% | -3.3% | -40.6% |
| GMGEX | -0.2% | 16.0% | -1.1% | -16.5% | 10.5% | -3.7% | -58.3% |
| SPY | 5.1% | 19.2% | 26.3% | -19.8% | 13.3% | -4.2% | -59.8% |
2012 to end
| Mean | Vol | Sharpe | Min | Max | 5th Percentile | Max Drawdown | |
|---|---|---|---|---|---|---|---|
| GMWAX | 4.9% | 9.8% | 50.5% | -10.5% | 7.6% | -2.0% | -24.5% |
| GBMFX | 3.7% | 8.0% | 45.9% | -9.6% | 6.8% | -1.6% | -23.9% |
| GQETX | 13.4% | 14.6% | 91.3% | -13.0% | 11.8% | -2.8% | -27.6% |
| GMGEX | 6.3% | 15.3% | 41.2% | -13.7% | 10.3% | -3.4% | -34.3% |
| SPY | 13.7% | 15.8% | 86.7% | -14.5% | 12.1% | -3.1% | -31.9% |
# Output from previous execution
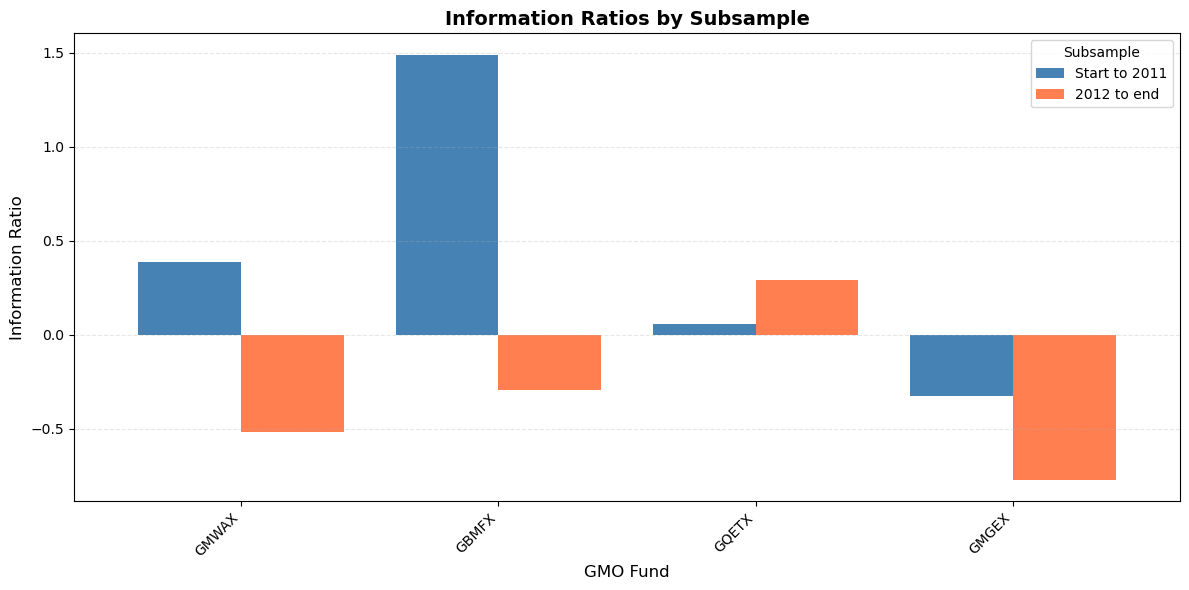
Start to 2011
| alpha | SPY | r-squared | Treynor Ratio | Info Ratio | |
|---|---|---|---|---|---|
| GMWAX | 2.9% | 40.4% | 51.5% | 11.9% | 38.5% |
| GBMFX | 7.3% | 30.1% | 58.7% | 29.1% | 149.1% |
| GQETX | 0.3% | 70.1% | 86.3% | 3.7% | 5.8% |
| GMGEX | -3.0% | 67.4% | 67.6% | -0.3% | -32.4% |
2012 to end
| alpha | SPY | r-squared | Treynor Ratio | Info Ratio | |
|---|---|---|---|---|---|
| GMWAX | -2.5% | 54.1% | 76.2% | 9.1% | -51.7% |
| GBMFX | -1.6% | 38.5% | 56.8% | 9.6% | -29.6% |
| GQETX | 1.1% | 89.4% | 92.7% | 14.9% | 28.9% |
| GMGEX | -5.5% | 86.2% | 78.7% | 7.3% | -77.3% |
# Output from previous execution
# Output from previous execution
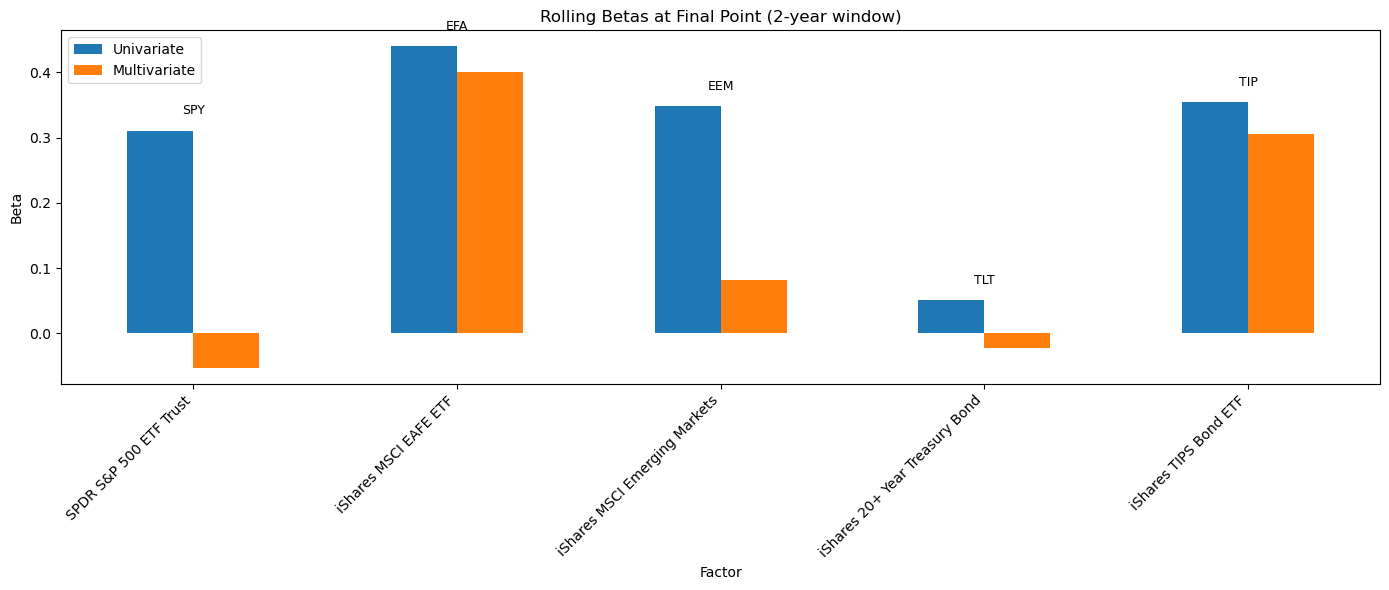
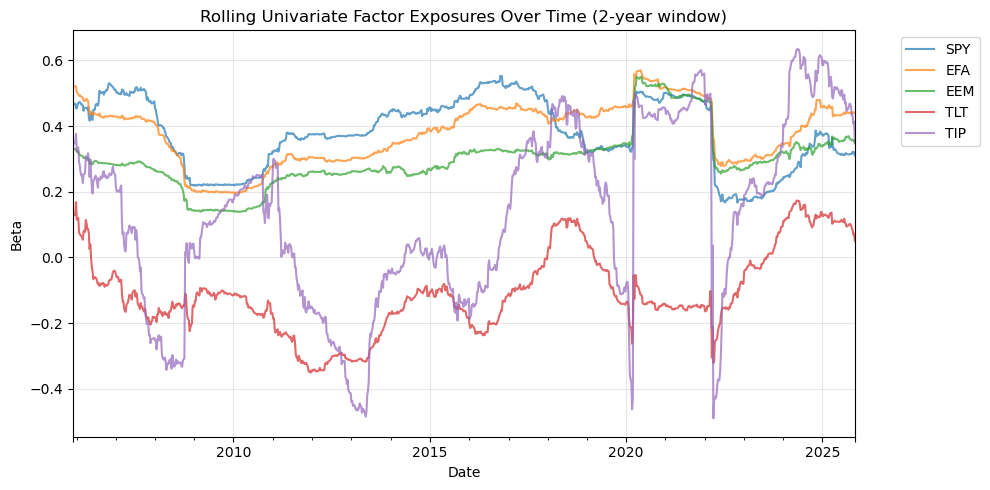
| alpha | SPY | EFA | EEM | TLT | TIP | r-squared | Info Ratio | |
|---|---|---|---|---|---|---|---|---|
| GMWAX | 0.7% | 15.6% | 28.5% | 6.5% | 2.5% | 9.1% | 88.9% | 21.9% |
| GBMFX | 2.2% | 4.7% | 20.2% | 9.5% | -1.4% | 10.1% | 71.6% | 53.0% |
# Output from previous execution
# Output from previous execution
# Output from previous execution

# Output from previous execution
| forecast | |
|---|---|
| SPY | -2.0% |
| EFA | -0.5% |
| EEM | -3.2% |
| TLT | -0.9% |
| TIP | 0.0% |
| IJR | -2.0% |
| GWX | -1.1% |
| EMB | 2.1% |
| BWX | -2.8% |
# Output from previous execution
| forecast | actual | |
|---|---|---|
| SPY | -2.0% | 14.2% |
| EFA | -0.5% | 6.8% |
| EEM | -3.2% | 6.3% |
| TLT | -0.9% | 4.8% |
| TIP | 0.0% | 3.4% |
| IJR | -2.0% | 13.1% |
| GWX | -1.1% | 8.6% |
| EMB | 2.1% | 4.0% |
| BWX | -2.8% | 0.5% |
# Output from previous execution
Text(0.5, 0, '')
