


Unconstrained Optimization#
Data#
All the analysis below applies to the data set,
data/spx_returns_weekly.xlsxThe file has weekly returns.
For annualization, use 52 periods per year.
Consider only the following 10 stocks…
As well as the ETF,
Data Processing#
| name | mkt cap (billions $) | |
|---|---|---|
| ticker | ||
| AAPL | Apple Inc | 4,631 |
| NVDA | NVIDIA Corp | 5,105 |
| MSFT | Microsoft Corp | 2,861 |
| GOOGL | Alphabet Inc | 4,336 |
| AMZN | Amazon.com Inc | 2,639 |
| META | Meta Platforms Inc | 1,699 |
| TSLA | Tesla Inc | 1,531 |
| AVGO | Broadcom Inc | 1,903 |
| BRK/B | Berkshire Hathaway Inc | 1,064 |
| LLY | Eli Lilly & Co | 1,119 |
1. Risk Statistics#
1.1.#
Display a table with the following metrics for each of the return series.
mean (annualized)
volatility (annualized)
Sharpe ratio (annualized)
skewness
kurtosis
maximum drawdown
Note#
We have total returns, and Sharpe ratio is technically defined for excess returns. Don’t worry about the difference. (Or subtract SHV if you prefer.)
1.2.#
As a standalone investment, which is most attractive? And least? Justify your answer.
1.3.#
For each investment, estimate a regression against SPY. Report the
alpha (annualized as a mean)
beta
info ratio
r-squared
Based on this table, which investment seems most attractive relative to holding SPY?
Solution 1.1.#
| Mean | Vol | Sharpe | Min | Max | skewness | kurtosis | max drawdown | |
|---|---|---|---|---|---|---|---|---|
| AAPL | 24.9% | 27.8% | 0.895 | -17.5% | 14.7% | -0.182 | 1.805 | -34.6% |
| NVDA | 64.5% | 45.4% | 1.420 | -20.1% | 30.2% | 0.351 | 1.492 | -65.9% |
| MSFT | 23.5% | 23.8% | 0.989 | -13.5% | 14.0% | 0.133 | 1.685 | -35.1% |
| GOOGL | 27.0% | 28.7% | 0.939 | -12.0% | 25.8% | 0.533 | 3.104 | -41.9% |
| AMZN | 26.1% | 30.5% | 0.858 | -14.5% | 16.3% | -0.087 | 1.342 | -54.8% |
| META | 23.2% | 35.7% | 0.649 | -23.7% | 24.5% | 0.037 | 3.490 | -76.0% |
| TSLA | 43.7% | 58.0% | 0.755 | -25.9% | 33.3% | 0.559 | 1.634 | -72.2% |
| AVGO | 39.4% | 38.3% | 1.030 | -18.3% | 25.2% | 0.643 | 3.272 | -40.0% |
| BRK/B | 13.5% | 18.8% | 0.716 | -13.4% | 9.8% | -0.186 | 2.534 | -26.5% |
| LLY | 30.1% | 29.8% | 1.011 | -17.9% | 17.5% | 0.138 | 1.976 | -34.5% |
| SPY | 14.5% | 16.9% | 0.859 | -14.5% | 12.1% | -0.581 | 5.967 | -31.8% |
Solution 1.2.#
As a standalone investment, NVDA has
the best Sharpe, which is the best vol-adjusted return.
large positive skewness which is attractive.
large kurtosis, which would be bad with negative skewness but is appealing with positive skewness.
a large max drawdown.
If worried about the max drawdown, BRK/B may be a good choice.
smallest max drawdown
second-lowest Sharpe.
Solution 1.3.#
| alpha | Beta (SPY) | r-squared | Treynor Ratio | Info Ratio | |
|---|---|---|---|---|---|
| AAPL | 8.6% | 1.116 | 46.2% | 22.3% | 0.425 |
| NVDA | 39.6% | 1.718 | 40.8% | 37.6% | 1.133 |
| MSFT | 8.8% | 1.016 | 52.2% | 23.2% | 0.534 |
| GOOGL | 11.0% | 1.104 | 42.2% | 24.4% | 0.502 |
| AMZN | 10.1% | 1.107 | 37.7% | 23.6% | 0.419 |
| META | 6.0% | 1.182 | 31.3% | 19.6% | 0.204 |
| TSLA | 18.4% | 1.749 | 26.0% | 25.0% | 0.368 |
| AVGO | 18.7% | 1.423 | 39.5% | 27.7% | 0.630 |
| BRK/B | 2.1% | 0.782 | 49.3% | 17.2% | 0.159 |
| LLY | 21.3% | 0.606 | 11.8% | 49.8% | 0.762 |
| SPY | -0.0% | 1.000 | 100.0% | 14.5% | - |
Based on this table, NVDA is the most attractive. It not only has (by far) the highest alpha, but also the highest Info Ratio (which is the risk-adjusted alpha.)
2. Portfolio Allocation#
2.1.#
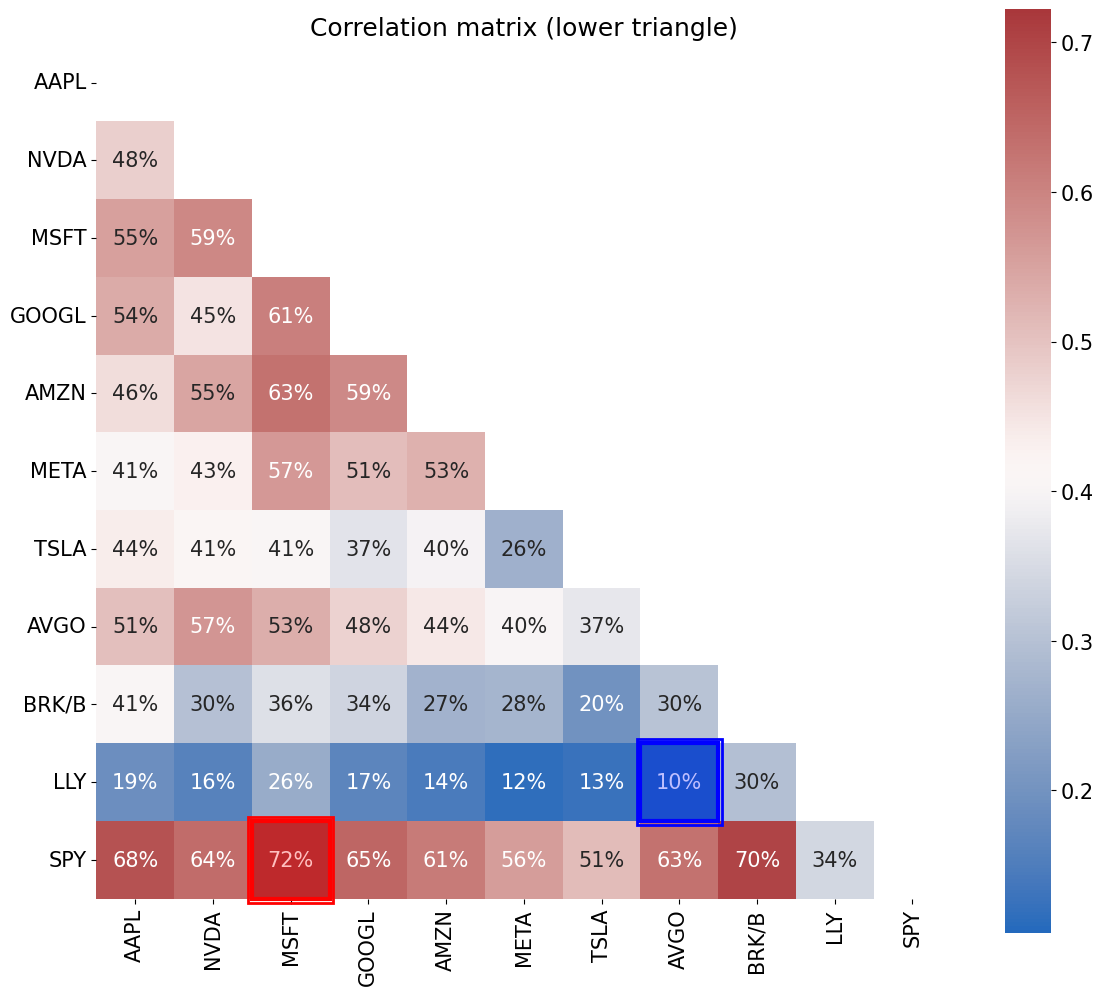
Display the correlation matrix of the returns.
Based on this information, which investment do you anticipate will get extra weight in the portfolio, beyond what it would merit for its mean return?
Report the maximally correlated assets and the minimally correlated assets.
2.2.#
Calculate the weights of the mean-variance optimized portfolio, also called the tangency portfolio.
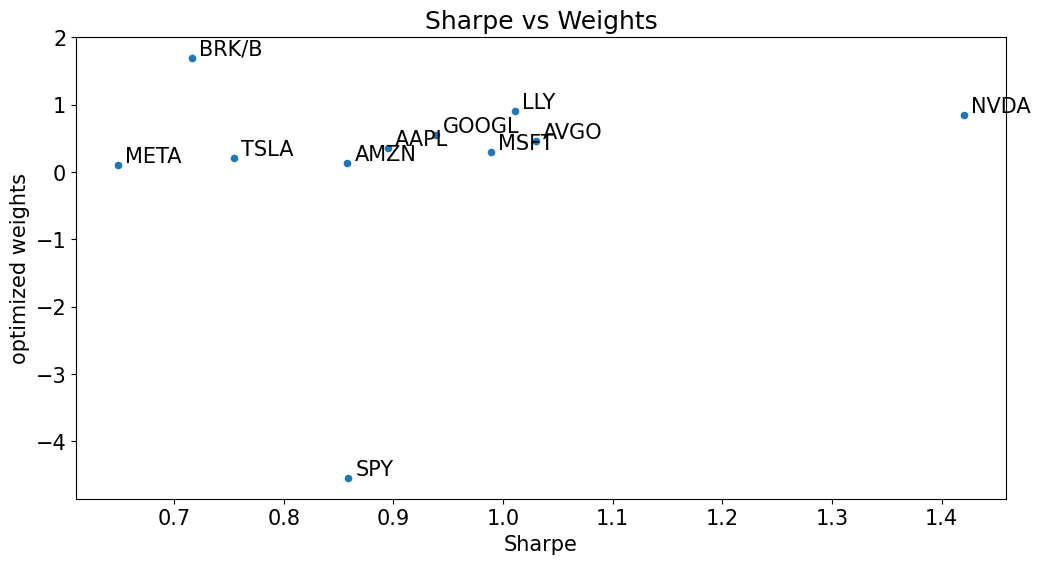
Display a table indexed by each investment, with the optimal weights in one column and the Sharpe ratios in another column.
Do the investments with the best Sharpe ratios tend to get the biggest weights?
Note:#
To estimate the optimal weights, consider using the provided function below.
2.3.#
Report the following performance statistics of the portfolio achieved with the optimized weights calculated above.
mean
volatility
Sharpe
(Annualize all three statistics.)
2.4.#
Try dropping the asset which had the biggest short position from the investment set. Re-run the optimization. What do you think of these new weights compared to the original optimized weights?
What is going on?
Solution 2.1#
(<Figure size 1200x1200 with 2 Axes>,
 <Axes: title={'center': 'Correlation matrix (lower triangle)'}>)
Solution 2.2#
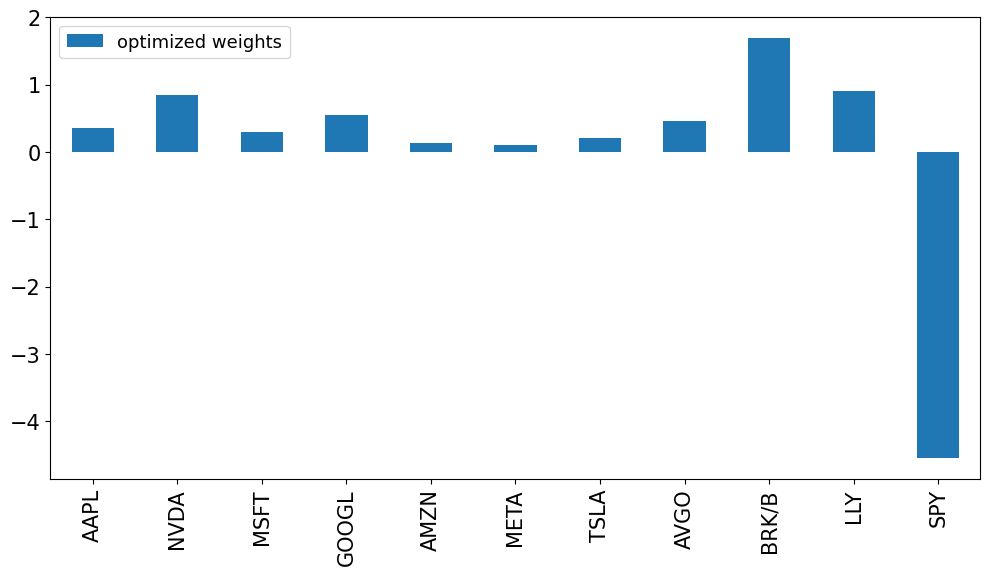
| optimized weights | Sharpe | |
|---|---|---|
| BRK/B | 169.6% | 0.716 |
| LLY | 90.5% | 1.011 |
| NVDA | 84.6% | 1.420 |
| GOOGL | 55.1% | 0.939 |
| AVGO | 45.4% | 1.030 |
| AAPL | 35.3% | 0.895 |
| MSFT | 30.1% | 0.989 |
| TSLA | 20.0% | 0.755 |
| AMZN | 12.9% | 0.858 |
| META | 10.0% | 0.649 |
| SPY | -453.8% | 0.859 |
Solution 2.3#
| Mean | Vol | Sharpe | Min | Max | |
|---|---|---|---|---|---|
| optimized weights | 102.01% | 52.22% | 1.9536 | -19.71% | 29.63% |
Solution 2.4#
The optimization is unrealistic in that it prescribes massive positions.
SPYis short nearly 450%.BRK-Bis long nearly 170%.
The optimizer is shorting SPY because…
it has lower mean return than the tech stocks (
NVDA)it is highly correlated to the tech stocks and can offset much of their risk.
The optimizer is massively long BRK…
even though
BRKhas the second-lowest Sharpe ratio of the investments. OnlyMETAis lower.But
BRKis highly correlated toSPYwhile having relatively low correlation to tech. Thus it lowers total risk.
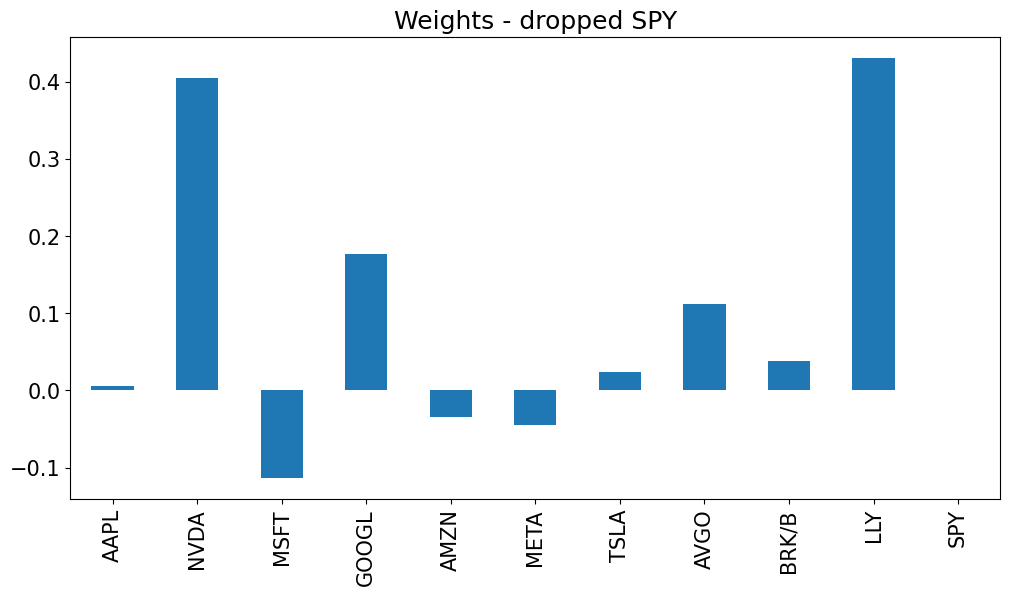
These weights are much more realistic. They are reasonable magnitudes and don’t include massive short positions.
Without SPY, the correlation matrix has relatively low correlations. Thus, the optimizer doesn’t think it can achieve such balanced (hedged) offsets, so it doesn’t prescribe extremes.
| Mean | Vol | Sharpe | Min | Max | |
|---|---|---|---|---|---|
| optimized weights | 102.0% | 52.2% | 1.954 | -19.7% | 29.6% |
| optimized ex SPY | 45.4% | 27.2% | 1.666 | -14.3% | 15.7% |
| gross mkt weight | |
|---|---|
| optimized weights | 1,007.5% |
| optimized ex SPY | 138.5% |