


MV Optimization Details#
Portfolio Fundamentals#
The risk of a portfolio is a nonlinear function of asset risks: covariances matter. Optimal portfolios either (i) maximize expected return for a given risk or (ii) minimize risk for a given return.
Portfolio mean and variance; diversification#
For two assets with weights \(w\) and \(1-w\):
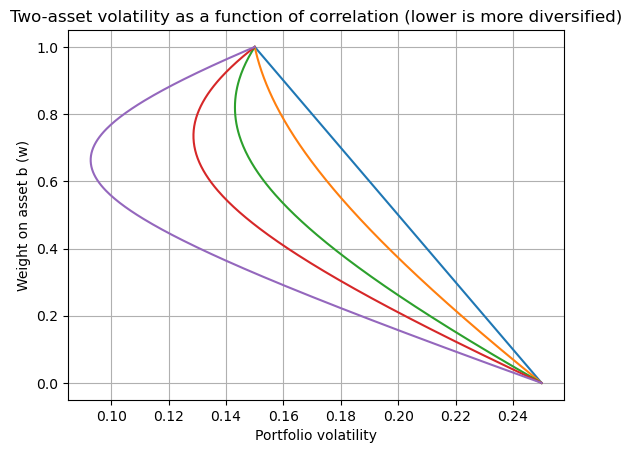
For long-only weights, volatility is linear in weights when \(\rho = 1\).
Diversification occurs whenever \(\rho < 1\) (it does not require \(\rho \le 0\)).
import numpy as np
import matplotlib.pyplot as plt

mu_b, mu_s = 0.08, 0.12
sig_b, sig_s = 0.15, 0.25

ws = np.linspace(0, 1, 251)
def port_stats(w, rho):
    mu = w*mu_b + (1-w)*mu_s
    var = (w**2)*(sig_b**2) + ((1-w)**2)*(sig_s**2) + 2*w*(1-w)*rho*sig_b*sig_s
    return mu, np.sqrt(var)

fig, ax = plt.subplots()
for rho in [1.0, 0.7, 0.3, 0.0, -0.5]:
    sigmas = [port_stats(w, rho)[1] for w in ws]
    ax.plot(sigmas, ws)  # plot risk vs weight to show curvature changes
ax.set_xlabel("Portfolio volatility")
ax.set_ylabel("Weight on asset b (w)")
ax.set_title("Two-asset volatility as a function of correlation (lower is more diversified)")
ax.grid(True)
plt.show()
Perfect hedge (\(\rho=-1\))#
With two assets and \(\rho = -1\), set weights so that \(\sigma_p=0\):
Diversification across n assets (general results)#
Let there be n risky assets with volatilities \(\sigma_i\) and covariances \(\sigma_{i,j}\). For portfolio weights \(w_i\) with \(\sum_i w_i = 1\), the variance is
Equally weighted case#
For \(w_i = \frac{1}{n}\),
Define the across-asset averages
Then
As \(n\to\infty\) with a diversified portfolio (no single name has material weight), the idiosyncratic term vanishes:
Identical vol and correlation#
If \(\sigma_i=\sigma\) for all i and \(\rho_{i,j}=\rho\) for \(i\neq j\):
Systematic risk: \(\rho\sigma^2\)
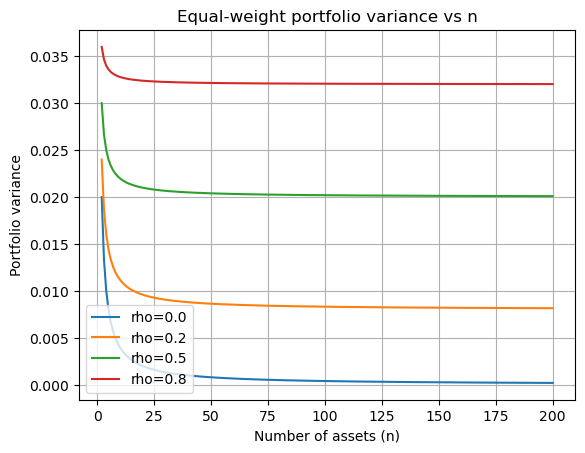
Idiosyncratic risk: \(\frac{1-\rho}{n}\sigma^2\) (diversifiable)
Special cases:
• \(\rho=1\): no diversification, \(\sigma_p^2=\sigma^2\).
• \(\rho=0\): fully diversifiable, \(\sigma_p^2=\frac{1}{n}\sigma^2 \to 0\).
• With two assets and \(\rho=-1\), one can choose weights to make \(\sigma_p=0\).
import numpy as np
import matplotlib.pyplot as plt

np.random.seed(0)
sig2 = 0.2**2
rhos = [0.0, 0.2, 0.5, 0.8]
ns = np.arange(2, 201)

def portfolio_var_equal(n, rho, sig2=sig2):
    # identical variances and pairwise correlation rho
    return (1/n)*sig2 + ((n-1)/n)*rho*sig2

fig, ax = plt.subplots()
for rho in rhos:
    vars_ = [portfolio_var_equal(n, rho) for n in ns]
    ax.plot(ns, vars_, label=f"rho={rho}")
ax.set_xlabel("Number of assets (n)")
ax.set_ylabel("Portfolio variance")
ax.set_title("Equal-weight portfolio variance vs n")
ax.grid(True)
ax.legend()
plt.show()
MV with a risk-free asset#
Let \(\mu\) be the vector of total-return means, \(r_f\) a constant risk-free rate, and \(\tilde\mu=\mu-r_f\mathbf1\). Assume \(\Sigma\) is positive definite and \(\tilde\mu\ne0\).
Risky weights \(w\) have no budget constraint. Cash has weight \(1-\mathbf1'w\), so portfolio total mean is \(r_f+w'\tilde\mu\) and variance is \(w'\Sigma w\).
Objective and first-order condition#
For target excess mean \(m\),
The Lagrangian and first-order condition are
Thus \(w=\lambda\Sigma^{-1}\tilde\mu\). Substituting into the mean constraint,
Write \(C_x=\tilde\mu'\Sigma^{-1}\tilde\mu>0\). Then
The objective is strictly convex, so this feasible stationary point is the unique minimum.
Variance and the efficient line#
Substituting the weights gives
The efficient branch uses \(m\ge0\), so
Negative targets form the lower, inefficient branch. At \(m=0\), the minimum-variance portfolio holds only cash.
Tangency and the cash weight#
Let \(B_x=\mathbf1'\Sigma^{-1}\tilde\mu\). When \(B_x\ne0\), normalize the risky bundle:
The cash weight is \(1-\delta_m\). When \(B_x>0\), the fully invested tangency portfolio has
If \(B_x=0\), the optimal risky bundle sums to zero and cannot be normalized to a fully invested tangency fund. The boxed optimizer remains valid.
MV without a risk-free asset#
Use total-return means \(\mu\) and target total mean \(m\). Risky weights must sum to one:
Objective and first-order condition#
The first-order condition gives
Define
Assume the means are not all equal. Then \(D>0\), and the two constraints are independent.
Solving for the coefficients#
Substitute the first-order condition into each constraint:
Invert this two-by-two system:
Therefore,
Strict convexity again makes this the unique minimum. Weights are affine in the target mean.
Frontier variance and GMV#
From \(\Sigma w=\lambda\mu+\eta\mathbf1\) and the constraints,
The global minimum-variance portfolio is
Only \(m\ge B/A\) is efficient. Below the GMV mean, another portfolio offers a higher mean with the same variance.
Two risky funds#
When \(B\ne0\), define \(w_0=\Sigma^{-1}\mu/B\). Both \(w_0\) and \(w_v\) sum to one. Substitute these normalizations into the optimizer:
The coefficients sum to \((AC-B^2)/D=1\), so
\(w_0\) is the zero-rate tangency portfolio. Its tangent passes through zero total return; it generally differs from the tangency portfolio based on excess returns. GMV is still risky.
If \(B=0\), use any two distinct target-mean portfolios in place of \(w_0\) and \(w_v\). The boxed optimizer does not require \(B\ne0\).
Comparing the two problems#
For a fully invested portfolio,
Thus a total-return target \(m\) and excess-return target \(m-r_f\) select the same weights when the reference rate is constant. Subtracting that constant also leaves the covariance matrix unchanged. Cash availability determines whether the budget constraint is imposed.
The cost of the budget constraint#
Use the same excess means \(\tilde\mu\), covariance \(\Sigma\), and target excess mean \(m\) for both problems. Define \(A=\mathbf1'\Sigma^{-1}\mathbf1\), \(B_x=\mathbf1'\Sigma^{-1}\tilde\mu\), \(C_x=\tilde\mu'\Sigma^{-1}\tilde\mu\), and \(D_x=AC_x-B_x^2>0\).
The budget constraint cannot reduce the minimum variance. If \(B_x\ne0\), the two frontiers meet at \(m=C_x/B_x\), where the cash-allowed solution already sums to one. For \(B_x>0\), this is the efficient tangency portfolio.
Cash available |
Risky assets only |
|---|---|
One risky bundle, rescaled with the target |
Two risky funds, mixed with the target |
Cash takes the remaining weight |
Risky weights sum to one |
Efficient straight line in mean-volatility space |
Efficient upper branch of the risky frontier |
The Harvard case comparison holds excess-return moments fixed to isolate this constraint. Its SHV benchmark varies over time, so that empirical comparison is not an identity between total-return and excess-return covariances.
Orthogonal MV portfolios#
For two fully invested minimum-variance portfolios with means \(m\) and \(q\), the first-order condition gives
Setting this covariance to zero and solving for \(q\) gives
In mean-volatility space, \(q\) is the intercept of the tangent at the portfolio with mean \(m\). The GMV portfolio has no uncorrelated partner on the fully invested frontier.
Complete Implementation#
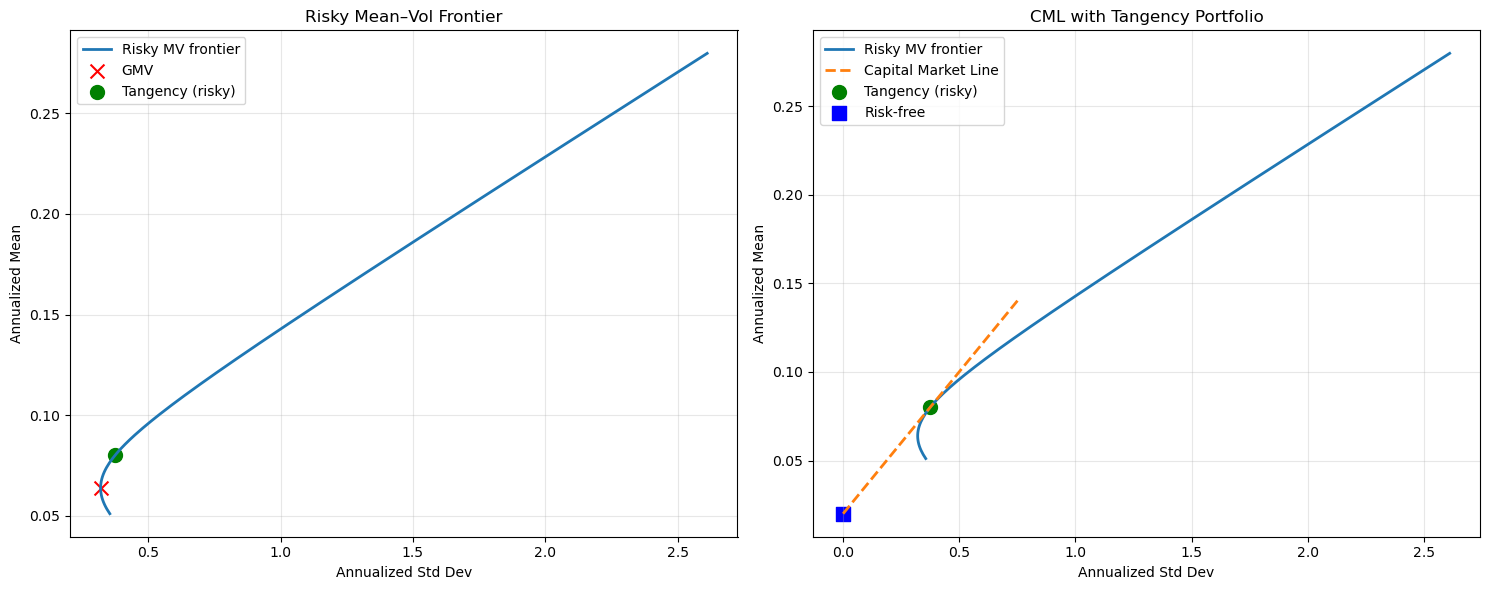
Below are complete, dependency-light helpers to compute GMV and tangency portfolios from \(\mu\) and \(\Sigma\), and to draw the risky MV frontier and the CML.
import numpy as np
import matplotlib.pyplot as plt

def gmv_weights(Sigma):
    """Global Minimum Variance portfolio weights."""
    inv = np.linalg.inv(Sigma)
    ones = np.ones(Sigma.shape[0])
    w = inv @ ones
    w = w / (ones @ inv @ ones)
    return w

def risky_tangency_weights(mu, Sigma, rf=0.0):
    """Tangency portfolio weights (risky assets only)."""
    tilde_mu = mu - rf
    inv = np.linalg.inv(Sigma)
    ones = np.ones(Sigma.shape[0])
    w = inv @ tilde_mu
    w = w / (ones @ inv @ tilde_mu)
    return w

def mv_frontier(mu, Sigma, num=100):
    """Return (sigmas, means) for the risky MV frontier (no rf)."""
    inv = np.linalg.inv(Sigma)
    ones = np.ones(Sigma.shape[0])
    phi0 = mu @ inv @ mu
    phi1 = mu @ inv @ ones
    phi2 = ones @ inv @ ones
    # Parameterize by target mean between GMV mean and a high value
    mu_gmv = (gmv_weights(Sigma) @ mu)
    mu_hi = float(max(mu_gmv*3, mu_gmv + np.sqrt(phi0)))  # heuristic span
    mus = np.linspace(mu_gmv*0.8, mu_hi, num)
    vars_ = (phi0 - 2*phi1*mus + phi2*mus**2) / (phi0*phi2 - phi1**2)
    sigs = np.sqrt(np.maximum(vars_, 0))
    return sigs, mus

def normalize_weights(w):
    """Normalize weights to sum to 1."""
    s = w.sum()
    return w / s

def mvp_weights(Sigma):
    """Minimum Variance Portfolio weights."""
    one = np.ones(Sigma.shape[0])
    w_unnorm = np.linalg.solve(Sigma, one)
    return normalize_weights(w_unnorm)

def tangency_weights(mu, Sigma):
    """Tangency portfolio weights."""
    w_unnorm = np.linalg.solve(Sigma, mu)
    return normalize_weights(w_unnorm)

def port_stats_from_w(w, mu, Sigma):
    """Portfolio statistics from weights."""
    mu_p = w @ mu
    sig_p = np.sqrt(w @ Sigma @ w)
    return mu_p, sig_p
Example: 4-asset portfolio#
# Toy example with 4 assets
mu = np.array([0.06, 0.08, 0.10, 0.12])  # expected excess returns
std = np.array([0.10, 0.15, 0.20, 0.25])
corr = np.array([
    [1.0, 0.3, 0.2, 0.1],
    [0.3, 1.0, 0.4, 0.2],
    [0.2, 0.4, 1.0, 0.5],
    [0.1, 0.2, 0.5, 1.0],
])
Sigma = np.outer(std, std) * corr

wV = mvp_weights(Sigma)
wT = tangency_weights(mu, Sigma)

print("MVP weights:", np.round(wV, 4))
print("Tangency weights:", np.round(wT, 4))

# Portfolio statistics
mu_V, sig_V = port_stats_from_w(wV, mu, Sigma)
mu_T, sig_T = port_stats_from_w(wT, mu, Sigma)

print(f"\nMVP: μ={mu_V:.4f}, σ={sig_V:.4f}")
print(f"Tangency: μ={mu_T:.4f}, σ={sig_T:.4f}")
MVP weights: [0.7125 0.1818 0.0396 0.0661]
Tangency weights: [0.5465 0.2207 0.0863 0.1466]

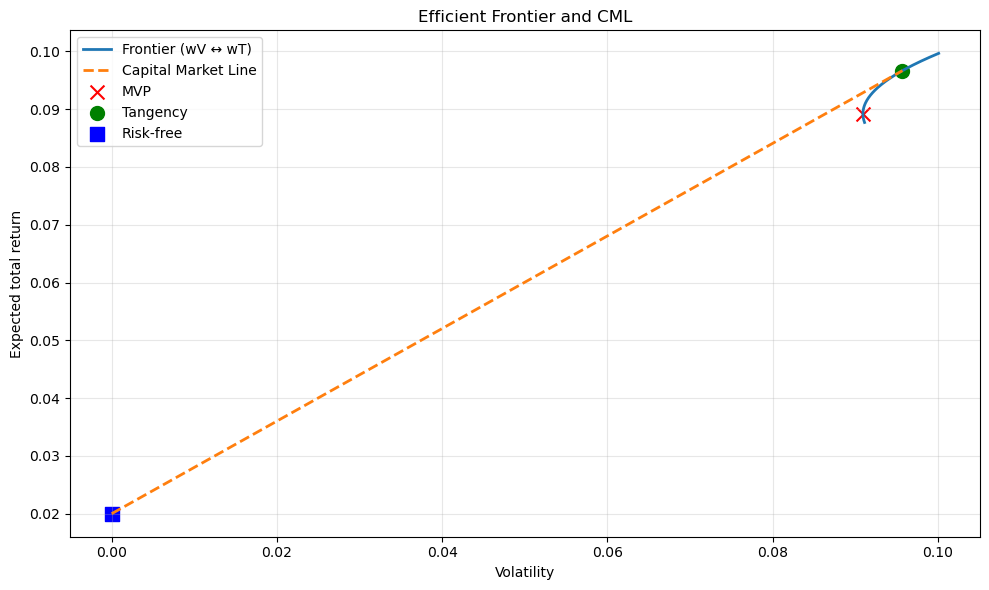
MVP: μ=0.0692, σ=0.0909
Tangency: μ=0.0767, σ=0.0957
Efficient frontier visualization#
# Frontier from combining wV and wT over delta grid
deltas = np.linspace(-0.2, 1.4, 161)
mus, sigs = [], []
for d in deltas:
    w = d*wT + (1-d)*wV
    m, s = port_stats_from_w(w, mu, Sigma)
    mus.append(m)
    sigs.append(s)

# Risk-free rate
rf = 0.02
# Translate to total return space for the plot: add rf back to excess return means
total_mus = np.array(mus) + rf
total_rf = rf

# CML: line through (0, rf) and the tangency point in total-return space
mu_T_excess, sig_T = port_stats_from_w(wT, mu, Sigma)
mu_T_total = mu_T_excess + rf

fig, ax = plt.subplots(figsize=(10, 6))
ax.plot(sigs, total_mus, label="Frontier (wV ↔ wT)", linewidth=2)
ax.plot([0, sig_T], [total_rf, mu_T_total], label="Capital Market Line", linewidth=2, linestyle='--')
ax.scatter([sig_V], [mu_V + rf], marker="x", s=100, label="MVP", color='red')
ax.scatter([sig_T], [mu_T_total], marker="o", s=100, label="Tangency", color='green')
ax.scatter([0], [rf], marker="s", s=100, label="Risk-free", color='blue')
ax.set_xlabel("Volatility")
ax.set_ylabel("Expected total return")
ax.set_title("Efficient Frontier and CML")
ax.grid(True, alpha=0.3)
ax.legend()
plt.tight_layout()
plt.show()
Advanced example: 6-asset portfolio with CML#
# --- Advanced example (replace with your estimates) ---
np.random.seed(0)
n = 6
A = np.random.randn(n, n)
Sigma = A @ A.T / n + 0.05*np.eye(n)   # PD covariance
mu = np.linspace(0.03, 0.12, n)        # ascending means
rf = 0.02

w_gmv = gmv_weights(Sigma)
w_tan = risky_tangency_weights(mu, Sigma, rf=rf)

sig_risky, mu_risky = mv_frontier(mu, Sigma, num=200)

# Risk-free mix line (CML): line through (sigma=0, mean=rf) tangent at risky tangency point
tan_sigma = float(np.sqrt(w_tan @ Sigma @ w_tan))
tan_mean = float(w_tan @ mu)
cml_sigmas = np.linspace(0, tan_sigma*2, 100)
# Slope is Sharpe of tangency: (tan_mean - rf) / tan_sigma
cml_means = rf + (tan_mean - rf) / tan_sigma * cml_sigmas

# --- Plot 1: Risky MV frontier ---
fig, (ax1, ax2) = plt.subplots(1, 2, figsize=(15, 6))

ax1.plot(sig_risky, mu_risky, label="Risky MV frontier", linewidth=2)
ax1.scatter([np.sqrt(w_gmv @ Sigma @ w_gmv)], [w_gmv @ mu], marker="x", s=100, label="GMV", color='red')
ax1.scatter([tan_sigma], [tan_mean], marker="o", s=100, label="Tangency (risky)", color='green')
ax1.set_xlabel("Annualized Std Dev")
ax1.set_ylabel("Annualized Mean")
ax1.legend()
ax1.set_title("Risky Mean–Vol Frontier")
ax1.grid(True, alpha=0.3)

# --- Plot 2: Capital Market Line (with rf) ---
ax2.plot(sig_risky, mu_risky, label="Risky MV frontier", linewidth=2)
ax2.plot(cml_sigmas, cml_means, label="Capital Market Line", linewidth=2, linestyle='--')
ax2.scatter([tan_sigma], [tan_mean], marker="o", s=100, label="Tangency (risky)", color='green')
ax2.scatter([0], [rf], marker="s", s=100, label="Risk-free", color='blue')
ax2.set_xlabel("Annualized Std Dev")
ax2.set_ylabel("Annualized Mean")
ax2.legend()
ax2.set_title("CML with Tangency Portfolio")
ax2.grid(True, alpha=0.3)

plt.tight_layout()
plt.show()

print("GMV weights:", np.round(w_gmv, 4))
print("Tangency (risky) weights:", np.round(w_tan, 4))
print("Tangency Sharpe:", np.round((tan_mean - rf)/tan_sigma, 4))
GMV weights: [ 0.0449  0.4636  0.382   0.0771 -0.2622  0.2946]
Tangency (risky) weights: [ 0.0788  0.2255  0.294   0.0723 -0.1107  0.4401]
Tangency Sharpe: 0.1602
References#
Back, Asset Pricing and Portfolio Choice Theory, Ch. 5.
Bodie, Kane, and Marcus, Investments, Ch. 7.