


Risk and Return Metrics#
import pandas as pd
import numpy as np
import datetime
import warnings

import matplotlib.pyplot as plt
%matplotlib inline
plt.rcParams['figure.figsize'] = (8,4)
plt.rcParams['font.size'] = 13
plt.rcParams['legend.fontsize'] = 13

from matplotlib.ticker import (MultipleLocator,
                               FormatStrFormatter,
                               AutoMinorLocator)

from sklearn.linear_model import LinearRegression
from cmds.portfolio import *
from cmds.risk import *
from cmds.plot_tools import plot_triangular_matrix
LOADFILE = '../data/risk_etf_data.xlsx'
info = pd.read_excel(LOADFILE,sheet_name='descriptions').set_index('ticker')
rets = pd.read_excel(LOADFILE,sheet_name='total returns').set_index('Date')
prices = pd.read_excel(LOADFILE,sheet_name='prices').set_index('Date')

FREQ = 252
AS_OF = rets.index.max()
Risk#
Volatility or More?#
What is meant by risk?
May be associated with
loss
volatility
correlation
worst outcomes
sensitivity
Various risk measures try to give information on all these.
Return, Price, PnL, Other?#
Our discussion of risk will be general to any asset class.
Examples are across various assets.
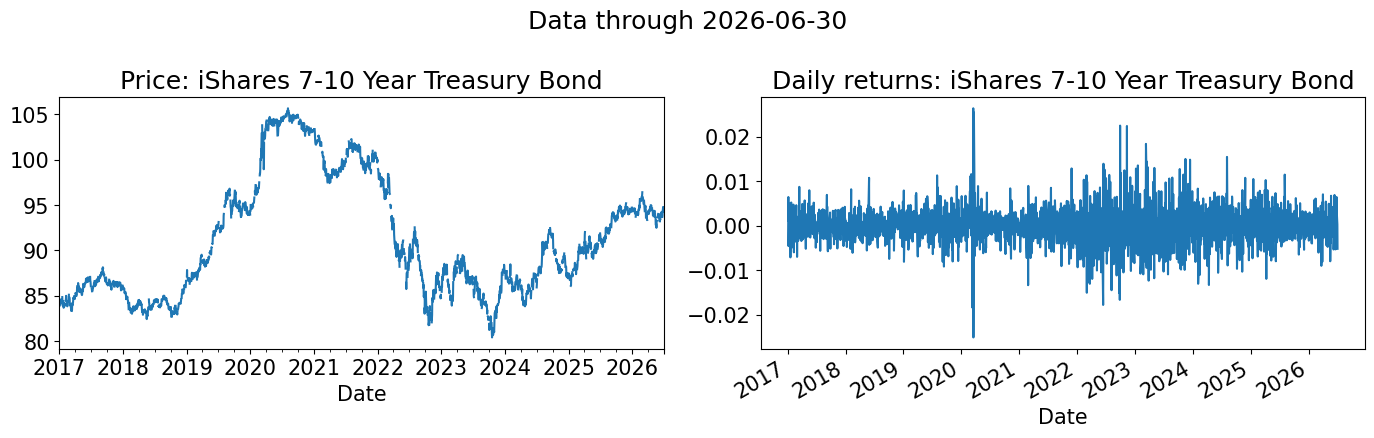
The object of analysis will depend on the asset class:
bonds and options: price
equities, futures, and currency: return
At times, it will make sense to examine profit and loss (PnL).
TICK = 'IEF'
fig, ax = plt.subplots(1,2,figsize=(14,4.5))
desc = info.loc[TICK,'shortName']
prices[TICK].plot(ax=ax[0],title=f'Price: {desc}')
rets[TICK].plot(ax=ax[1],title=f'Daily returns: {desc}')
fig.suptitle(f'Data through {AS_OF:%Y-%m-%d}')
plt.tight_layout()
plt.show()
Tools#
The tools used are different than fixed income and options pricing. Relatively
more statistics
less math
For bonds and options, we saw risk via
mathematical sensitivity of prices
For equities and other assets, we will be using
statistical sensitivity of returns (or scaled prices)
Model Approach#
The modeling approach will rely on formulating the data such that it is
stationary
Nearly always
This is often the motive for switching between prices, profits, returns, etc.
iid (indepently and identically distributed)
Much of the complication is achieving this.
normally distributed?
Rarely required.
A useful comparison.
At times a simplfiying approximation
Note: Difference to Pricing#
Risk uses different tools than pricing.
No alternative probability measures.
Volatility will mean actual variation, not options pricing quotes.
Mostly use discrete-time models, not continuous-time stochastic calculus.
Starting Point#
Question:
Is a 10-year Treasury Note risky?
To start, we consider risk over a single given period.
This is not just pedagogical
Risk managers will mostly focus on risk over the next period.
Delta, duration are good examples of this
For some problems, we will need to consider
multiple-period risk
cumulative returns
Moments#
Data#
As an example for analyzing risk, we consider
ETF data on various asset classes
daily frequency
2017 through present
The ETF data ensures
we are looking at traded security returns, not indexes
thus, no issue of rolling futures, carry on FX, etc.
Though there may be differences due to fund expenses and fund tracking error (oil?)
info
| shortName | quoteType | currency | volume | totalAssets | longBusinessSummary | |
|---|---|---|---|---|---|---|
| ticker | ||||||
| SPY | State Street SPDR S&P 500 ETF T | ETF | USD | 41262786 | 7.811889e+11 | The trust seeks to achieve its investment obje... |
| VEA | Vanguard FTSE Developed Markets | ETF | USD | 11611688 | 3.163098e+11 | The fund employs an indexing investment approa... |
| UPRO | ProShares UltraPro S&P 500 | ETF | USD | 1874975 | 5.326334e+09 | The fund invests in financial instruments that... |
| GLD | SPDR Gold Shares | ETF | USD | 5137090 | 1.300533e+11 | The Trust holds gold bars and from time to tim... |
| USO | United States Oil Fund | ETF | USD | 4435026 | 1.880301e+09 | USO seeks to achieve its investment objective ... |
| FXE | Invesco CurrencyShares Euro Cur | ETF | USD | 56794 | 3.743631e+08 | NaN |
| BTC | Bitcoin USD | CRYPTOCURRENCY | USD | 13774837760 | NaN | NaN |
| HYG | iShares iBoxx $ High Yield Corp | ETF | USD | 23162589 | 1.762612e+10 | The underlying index is a rules-based index co... |
| IEF | iShares 7-10 Year Treasury Bond | ETF | USD | 6385811 | 4.709337e+10 | The underlying index consists of publicly-issu... |
| TIP | iShares TIPS Bond ETF | ETF | USD | 995980 | 1.469678e+10 | The index tracks the performance of inflation-... |
| SHV | iShares 0-1 Year Treasury Bond | ETF | USD | 2204808 | 2.094584e+10 | The fund will invest at least 80% of its asset... |
Mean#
The mean is the first moment of the (unspecified) distribution:
The sample estimator for it is
Note that this is often expressed with “bar” notation, \(\bar{r}\).
Here the notation is \(\hat{\mu}\) for symmetry with many estimators below using “hat” notation.
Important for risk?#
For measuring and analyzing risk, we will mostly consider de-meaned data.
We want to know the possible outcomes relative to the mean.
Interesting models of the mean are more useful for forecasting returns for directional investing.
Note#
Having an incorrect measure of the mean will cause error in our relative assessments.
However, the main focus will be risk over short periods, for which the mean (trend) will not matter much to the calculation.
Data: Means#
The mean ETF data is listed below for price an return.
Technical Note#
Does it make sense to analyze this for price and return?
That is, do they both satisfy basic statistical properties to be well-suited to examining unconditional moments?
pd.concat([prices.mean(),rets.mean()*FREQ],axis=1,keys=['price','return']).style.format({'price':'{:.2f}','return':'{:.2%}'})
| price | return | |
|---|---|---|
| SPY | 388.99 | 15.93% |
| VEA | 41.03 | 11.52% |
| UPRO | 48.34 | 40.38% |
| GLD | 190.10 | 14.05% |
| USO | 75.56 | 9.44% |
| FXE | 101.35 | 1.26% |
| BTC | 35692.39 | 65.50% |
| HYG | 63.51 | 4.74% |
| IEF | 91.21 | 1.45% |
| TIP | 96.72 | 2.84% |
| SHV | 95.49 | 2.33% |
Variance and Volatility (StdDev)#
The variance is the second centered moment of the (unspecified) distribution.
The usual sample estimator for the variance is
Question#
Note that though there are \(\Ntime\) data points in the sample, the estimator for the variance uses \(\Ntime-1\).
What is the reason?
statistically
conceptually
Standard Deviation#
The standard deviation (in population and in sample) is the square root of the formulas above.
We will often refer to this as the volatility.
One could make the distinction of volatility as the time-varying (instantaneous) standard deviation of the process, but more often it is used synonomously with standard deviation.
Technical Points#
Non-negativity#
The standard deviation is defined in such a way that it is always non-negative.
Thus, models of volatility (realized: GARCH, implied: SABR) have to be careful to ensure this holds.
Centering#
The variance is the second squared moment. Note that inside the expectation is \(r-\mu\).
The second (uncentered) moment is \(\E\left[r^2\right]\), and it is sometimes useful to have the variance as the difference of the (uncentered) first and second moments:
vol = (rets.std().to_frame('vol')*np.sqrt(FREQ))
vol['variance'] = vol['vol']**2
vol.style.format('{:.2%}')
| vol | variance | |
|---|---|---|
| SPY | 18.29% | 3.34% |
| VEA | 17.43% | 3.04% |
| UPRO | 54.79% | 30.02% |
| GLD | 16.22% | 2.63% |
| USO | 39.18% | 15.35% |
| FXE | 7.25% | 0.53% |
| BTC | 67.51% | 45.58% |
| HYG | 8.30% | 0.69% |
| IEF | 6.68% | 0.45% |
| TIP | 5.80% | 0.34% |
| SHV | 0.27% | 0.00% |
Higher Moments#
Skewness#
Skewness is the third moment (centered and scaled).
The sample estimator is
Note that the skewness
can be positive or negative
is NOT typically listed as a percentage
The skewness is negative for distributions where there is an asymmetric, “long left tail”.
Kurtosis#
Kurtosis is the fourth moment (centered and scaled).
The sample estimator is
Note that the kurtosis
is non-negative
is NOT typically listed as a percentage
Furthermore, kurtosis is typically expressed excess kurtosis, \(\kappa - 3\).
This is to compare it to the normal distribution, which has kurtosis of 3.
The skewness is negative for distributions where there is an asymmetric, “long left tail”.
get_moments(rets,FREQ)
| mean | vol | skewness | kurtosis | |
|---|---|---|---|---|
| SPY | 15.9% | 18.3% | -0.31 | 14.51 |
| VEA | 11.5% | 17.4% | -0.79 | 14.90 |
| UPRO | 40.4% | 54.8% | -0.39 | 15.28 |
| GLD | 14.1% | 16.2% | -0.63 | 7.67 |
| USO | 9.4% | 39.2% | -1.02 | 14.35 |
| FXE | 1.3% | 7.3% | 0.16 | 1.38 |
| BTC | 65.5% | 67.5% | 0.04 | 6.49 |
| HYG | 4.7% | 8.3% | 0.13 | 28.43 |
| IEF | 1.5% | 6.7% | 0.19 | 3.30 |
| TIP | 2.8% | 5.8% | 0.36 | 15.52 |
| SHV | 2.3% | 0.3% | 0.63 | 3.27 |
Annualizing the Moments#
To annualize the moments use the frequency, of data per year, \(\tau\),
annualize |
sign |
quote |
|
|---|---|---|---|
mean |
\(\tau\) |
+ / - |
% |
volatility |
\(\sqrt{\tau}\) |
+ |
% |
skewness |
1 |
+ / - |
number |
kurtosis |
1 |
+ |
number |
For instance, to annualize (trading)
daily data, \(\tau=252\).
monthly data, \(\tau=12\).
Distribution#
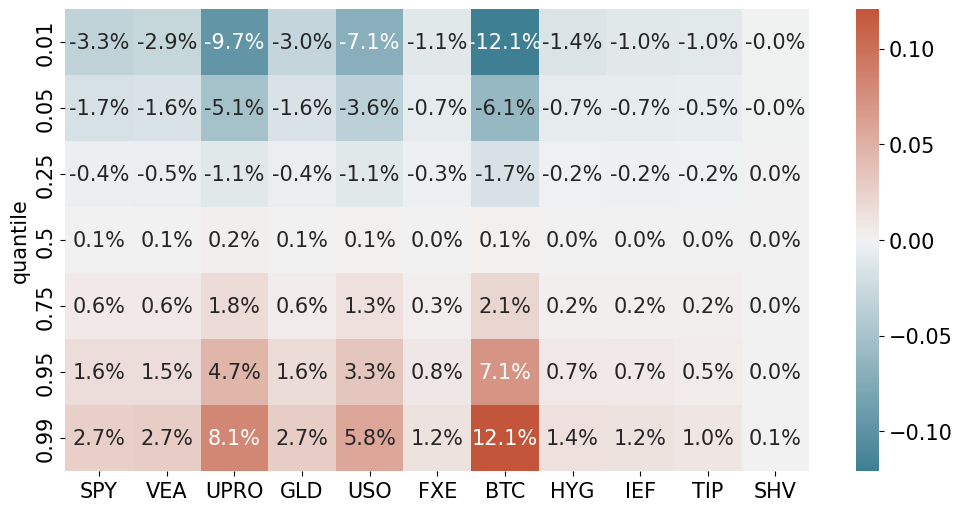
Quantiles#
The risk measures based on “moments” make use of data in the entire distribution.
This allows for high statistical power.
Those moments make no assumption about the distribution.
The quantiles
continue without any assumption on the distribution.
But they are estimating a single point on the distribution.
This means it gets less precision from the sample.
If the variable has a distribution with a continuous and strictly increasing cdf, denoted \(F\), with an inverse cdf of \(F^{-1}\). Then the quantile \(\pi\) is
The sample estimate is the order statistic.
Sort the sample into ascending order.
Define the sorted data as \(\{r_{(1)},\ldots,r_{(\Ntime)}\}\).
Median#
Of course, for \(\pi=0.5\), this is the median:
Technical Note#
If \(\pi\Ntime\) is not an integer, typical to take a linear interpretation between the nearest two ordered points.
from matplotlib.colors import TwoSlopeNorm

quantiles = rets.quantile(q=[.01,.05,.25,.5,.75,.95,.99])
quantiles.index.name = 'quantile'

quantiles.reset_index(inplace=True)
quantiles['quantile'] = quantiles['quantile'].astype(str)
quantiles.set_index('quantile',inplace=True)
quantiles.style.format('{:.1%}')

# Create a diverging colormap centered at 0
colors = sns.diverging_palette(220, 20, as_cmap=True)

# Plot heatmap with twoslope normalization
sns.heatmap(quantiles,
            annot=True,
            fmt='.1%',
            cmap=colors,
            norm=TwoSlopeNorm(vmin=quantiles.min().min(),
                             vcenter=0,
                             vmax=quantiles.max().max()))
plt.show()
Normal Distribution#
NONE of the measures discussed above rely on a normal distribution.
But later we will consider estimates that rely on an assumed distribution, and whether returns are normal.
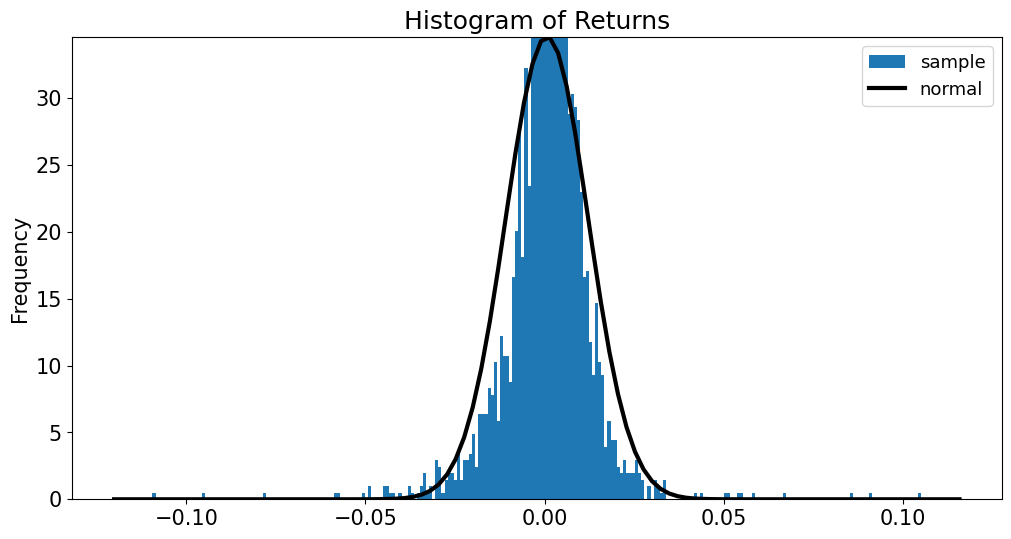
So how good of an approximation is a normal distribution?
data = rets['SPY']
fig = plot_normal_histogram(data,bins=250);
plt.title('Histogram of Returns');
plt.show()
Outliers#
The histogram doesn’t look too far off at first glance.
But consider the outliers.
A normal distribution implies 5 and 10 std.dev. outliers almost never happen.
In the sample above, there are numerous.
Outlier Table#
The outlier table below shows z-scores for the min and max return.
The final two columns show the probability of such values happening under a normal distribution.
outlier_normal(rets).set_caption('Daily')
| z min | z max | normal prob min | normal prob max | |
|---|---|---|---|---|
| SPY | -9.55 | 9.06 | 6.21e-22 | 0.00e+00 |
| VEA | -10.22 | 8.06 | 7.68e-25 | 3.33e-16 |
| UPRO | -10.17 | 8.06 | 1.33e-24 | 4.44e-16 |
| GLD | -10.11 | 6.17 | 2.52e-24 | 3.45e-10 |
| USO | -10.27 | 6.74 | 4.72e-25 | 8.06e-12 |
| FXE | -4.51 | 5.43 | 3.23e-06 | 2.81e-08 |
| BTC | -8.80 | 5.88 | 6.80e-19 | 2.11e-09 |
| HYG | -10.54 | 12.48 | 2.75e-26 | 0.00e+00 |
| IEF | -5.97 | 6.26 | 1.20e-09 | 1.93e-10 |
| TIP | -7.87 | 12.15 | 1.74e-15 | 0.00e+00 |
| SHV | -5.28 | 6.32 | 6.44e-08 | 1.35e-10 |
Astronomical#
The probabilities are astronomical.
Clearly the returns are not normally distributed–particularly for tail events.
Ironically, this means that a normal distribution as a rough approximation might be fine–except for the events we care most about in managing risk–big outliers.
Time Frequency#
However, consider that the normality may depend on the frequency of the data.
At finer granularity, (daily, intra-daily,) perhaps the aberrations are stronger.
At a less frequent time interval, perhaps these compound and average out.
Monthly returns#
The table below repeats the example for monthly returns.
retsM = prices.resample('ME').last().pct_change()
outlier_normal(retsM).set_caption('Monthly')
| z min | z max | normal prob min | normal prob max | |
|---|---|---|---|---|
| SPY | -3.04 | 2.51 | 1.20e-03 | 6.00e-03 |
| VEA | -3.51 | 2.92 | 2.22e-04 | 1.73e-03 |
| UPRO | -3.63 | 2.41 | 1.40e-04 | 7.92e-03 |
| GLD | -2.95 | 2.57 | 1.58e-03 | 5.09e-03 |
| USO | -4.58 | 4.41 | 2.30e-06 | 5.18e-06 |
| FXE | -2.40 | 2.59 | 8.23e-03 | 4.81e-03 |
| BTC | -2.00 | 2.92 | 2.29e-02 | 1.74e-03 |
| HYG | -4.82 | 2.92 | 7.11e-07 | 1.74e-03 |
| IEF | -2.56 | 2.34 | 5.16e-03 | 9.52e-03 |
| TIP | -4.74 | 2.78 | 1.08e-06 | 2.72e-03 |
| SHV | -1.64 | 1.86 | 5.10e-02 | 3.14e-02 |
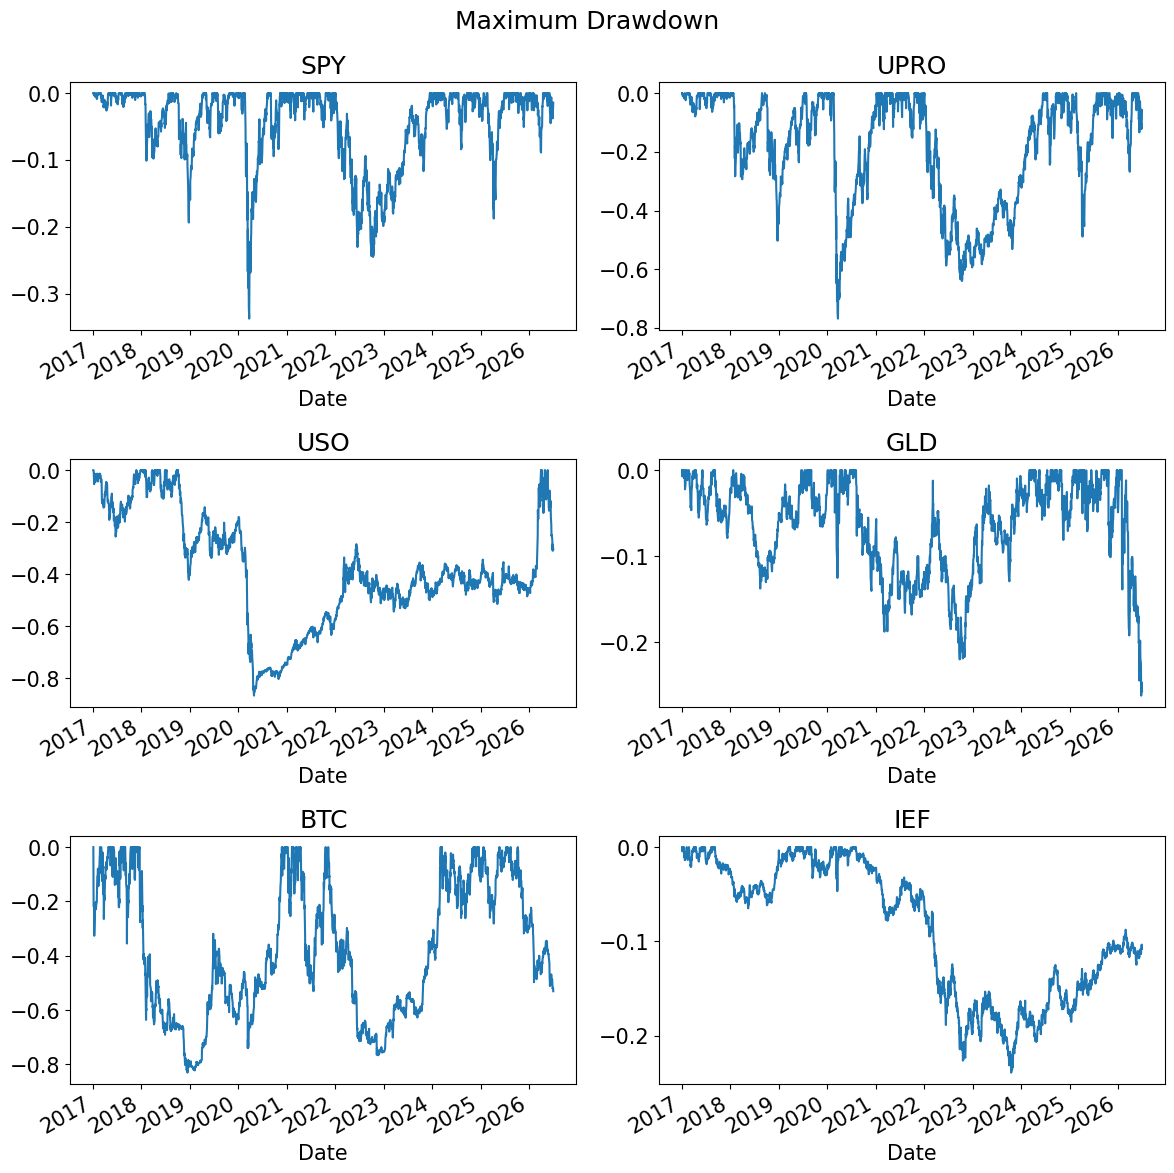
Maximum Drawdown#
The maximum drawdown (MDD) of a return series is the maximum cumulative loss suffered during the time period.
Visually, this is the largest peak-to-trough during the sample.
It is widely cited in performance evaluation to understand how badly the investment might perform.
Technical Note#
Maximum drawdown is widely cited in backtests.
This can be quite useful in understanding the scale / nature of the strategy, especially how it performs in certain scenarios.
It is less useful than the “moment” statistics above in forecasting the future.
It is a path-dependent statistic, and it has much less statistical precision.
Example#
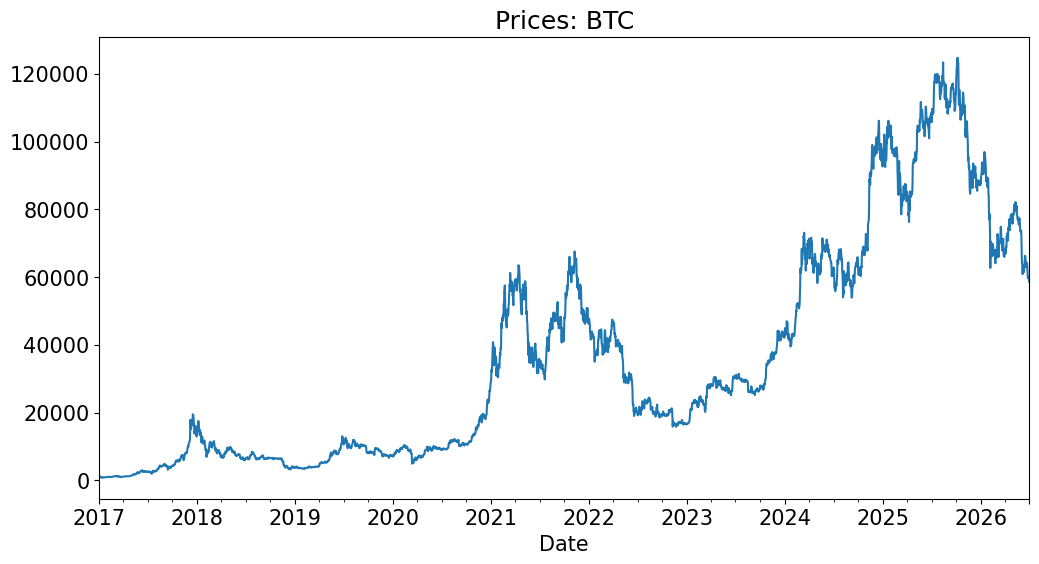
Consider the price chart below.
MDD is the largest peak-to-valley point of the graph.
This is not always easy to see from the price graph.
TICK = 'BTC'
prices[TICK].plot(title=f'Prices: {TICK}');
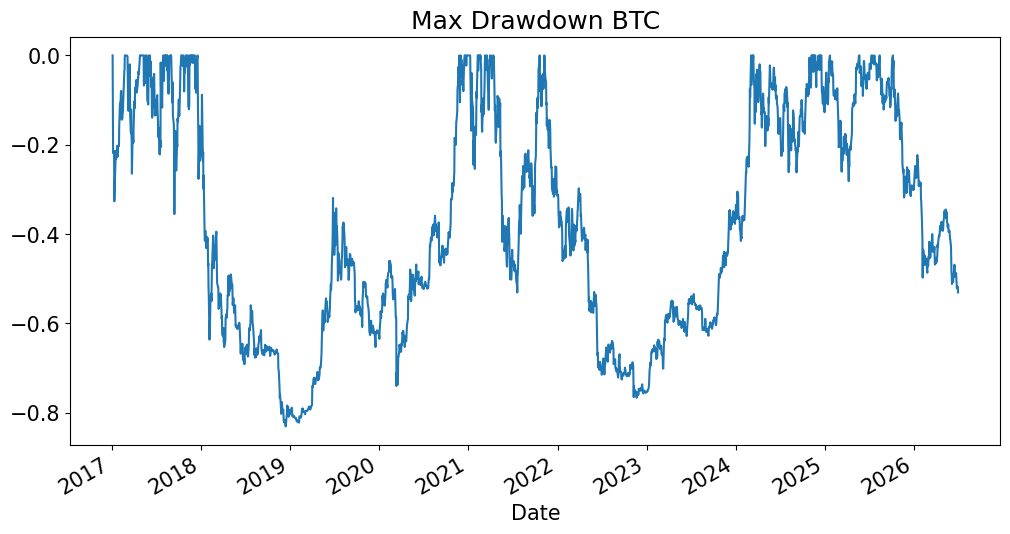
Consider a MDD chart#
For any point in time, it shows how far the strategy is below its max up to that point.
Whenever it is at 0, the strategy is at a current maximum.
def mdd_timeseries(rets):
    cum_rets = (1 + rets).cumprod()
    rolling_max = cum_rets.cummax()
    drawdown = (cum_rets - rolling_max) / rolling_max
    return drawdown
drawdown = mdd_timeseries(rets)
drawdown[TICK].plot(title=f'Max Drawdown {TICK}');
plt.show()
PLOT_TICKS = ['SPY','UPRO','USO','GLD','BTC','IEF']
n_plots = len(PLOT_TICKS)
n_rows = int(np.ceil(n_plots/2))
fig, ax = plt.subplots(n_rows, 2, figsize=(12, 4*n_rows))
ax = ax.flatten()

for i, tick in enumerate(PLOT_TICKS):
    drawdown[tick].plot(ax=ax[i], title=tick)

plt.suptitle('Maximum Drawdown')
plt.tight_layout()
plt.show()
maximumDrawdown(rets).style.format({
    'Skewness': '{:.2f}',
    'Kurtosis': '{:.2f}',
    'Max Drawdown': '{:.2%}',
    'Peak': lambda x: x.strftime('%Y-%m-%d') if pd.notna(x) else '',
    'Bottom': lambda x: x.strftime('%Y-%m-%d') if pd.notna(x) else '',
    'Recover': lambda x: x.strftime('%Y-%m-%d') if pd.notna(x) else '',
    'Duration (to Recover)': lambda x: f'{x.days:,.0f} days' if pd.notna(x) else ''
})
| Max Drawdown | Peak | Bottom | Recover | Duration (to Recover) | |
|---|---|---|---|---|---|
| SPY | -33.72% | 2020-02-19 | 2020-03-23 | 2020-08-10 | 173 days |
| VEA | -35.74% | 2018-01-26 | 2020-03-23 | 2020-11-16 | 1,025 days |
| UPRO | -76.82% | 2020-02-19 | 2020-03-23 | 2021-01-08 | 324 days |
| GLD | -26.21% | 2026-01-29 | 2026-06-24 | ||
| USO | -86.75% | 2018-10-03 | 2020-04-28 | 2026-03-30 | 2,735 days |
| FXE | -26.46% | 2018-02-01 | 2022-09-27 | ||
| BTC | -83.04% | 2017-12-18 | 2018-12-14 | 2020-11-30 | 1,078 days |
| HYG | -22.03% | 2020-02-13 | 2020-03-23 | 2020-11-04 | 265 days |
| IEF | -23.92% | 2020-08-04 | 2023-10-19 | ||
| TIP | -14.51% | 2021-11-09 | 2023-10-06 | 2026-02-27 | 1,571 days |
| SHV | -0.45% | 2020-04-07 | 2022-06-14 | 2022-10-07 | 913 days |
Multivariable Risk#
All the risk measures above are univariate.
The measures above for a return \(r\) depend only on functions of the distribution (sample) of \(r\).
We will need to consider multivariable measures.
As we will see, the risk for a portfolio will require these measures.
Notation#
Consider a return on asset \(i\) and \(j\), denoted as \(r_i\) and \(r_j\).
Note that these superscripts are not exponents but rather identifiers.
Covariance#
The covariance is defined as
A covariance of a variable with itself is the variance.
The sample estimate of the covariance is
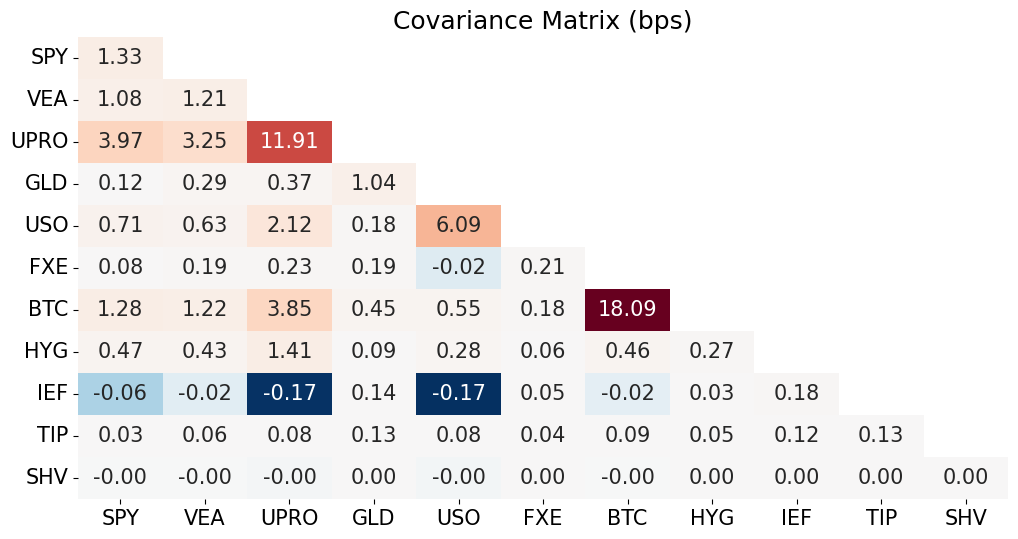
Covariance Matrix#
For \(\Nassets\) assets, it is easier to use matrix notation to write the coviariance \(\sigma_{i,j}\) as the \(i\) row and \(j\) column of the \(\Nassets\times \Nassets\) covariance matrix.
Note that the diagonal of the matrix is the set of asset variances, \(\sigma_{j,j}=\sigma^2_j\).
Let \(\rmat\) denote the \(\Ntime\times \Nassets\) matrix of sample returns.
Each of \(\Ntime\) rows is a sample observation (period of time).
Each of \(\Nassets\) columns is an asset return.
Perhaps somewhat confusingly, it is common to denote this covariance matrix using the capital Greek letter, \(\Sigma\). This looks like a summation sign, but it denotes the \(\Nassets\times \Nassets\) covariance:
The sample estimator is the \(\Nassets\times\Nassets\) matrix,
where \(\meanest\) denotes the \(\Nassets\times 1\) vector of sample averages:
and where \(\onevecNt\) denotes the \(\Ntime\times 1\) vector of ones.
Technical Note: Properties of the Covariance Matrix#
The covariance matrix is
symmetric: \(\Nassets(\Nassets+1)/2\) unique elements
positive (semi) definite
Positive definite
does not mean each element of the matrix, \(\sigma_{i,j}\) is positive
it means that any combination of the assets will have non-negative variance.
Mathematically, for any \(\Nassets\times 1\) \(w\),
cov_matrix = rets.cov()*100*100

# Set upper triangle to NaN
mask = np.triu(np.ones_like(cov_matrix), k=1)  # Using triu to get upper triangle including diagonal
cov_matrix[mask.astype(bool)] = np.nan

center = 0
vmin = cov_matrix.min().min()
vmax = cov_matrix.max().max()
norm = TwoSlopeNorm(vmin=vmin, vcenter=center, vmax=vmax)
sns.heatmap(cov_matrix, annot=True, fmt='.2f', norm=norm, cmap='RdBu_r', cbar=False)
plt.title('Covariance Matrix (bps)')
plt.show()
Correlation#
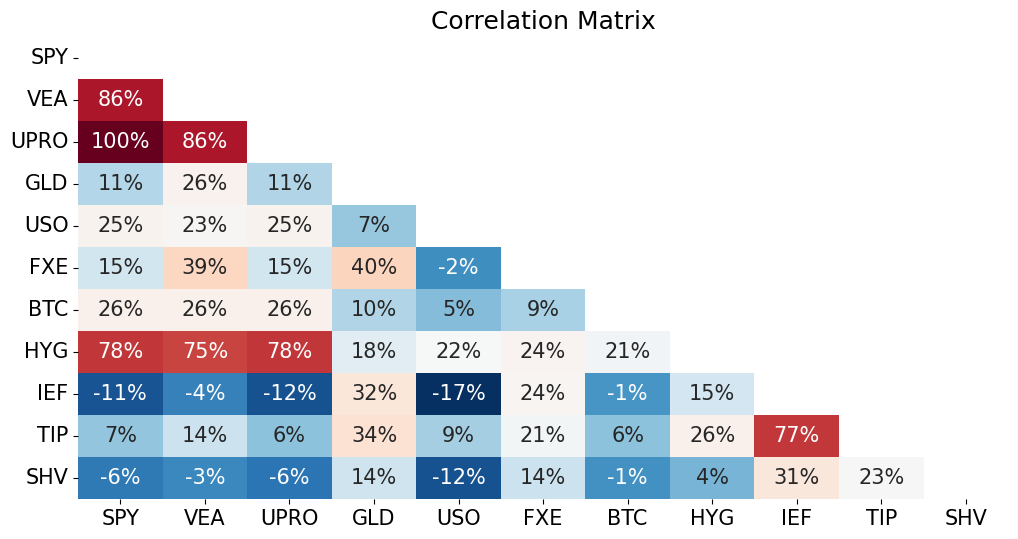
The scale of the covariance matrix makes it harder to interpret.
Consider the correlation, which rescales the covariance in a way that is much more useful for interpretation:
between -1 and 1
same sign as the covariance
Consider the matrix of correlations.
will be positive semi-definite, as is the covariance matrix.
# Plot correlation matrix
corr_matrix = rets.corr()
plot_triangular_matrix(corr_matrix, title='Correlation Matrix')
Beta#
Consider a linear decomposition of \(r_i\) on \(r_j\):
The OLS sample estimator of \(\beta\) is
where \(\rmat_j\) denotes the \(N\times 2\) matrix where the first column is a vector of ones and the second column is the vector of sample returns of \(r_{j,t}\) for \(1\le t\le \Ntime\).
Scaled correlation#
Equivalently, for a single-variable regression, the beta is simply a scaled correlation:
The sample estimator is then the product of the sample estimates of these standard deviations and the correlation.
Thus, for bivariate measures,
Covariance, correlation, and beta are just three ways of scaling the relationship#
COMP = 'SPY'
birisk = pd.DataFrame(dtype=float, columns=['corr','cov','beta'], index=rets.columns)
birisk['corr'] = rets.corr()[COMP]
birisk['cov'] = rets.cov()[COMP] * FREQ
for sec in rets.columns:
    birisk.loc[sec,'beta'] = LinearRegression().fit(rets[[COMP]],rets[[sec]]).coef_[0]

birisk.columns = [f'{COMP} {col}' for col in birisk.columns]
birisk.style.format({birisk.columns[0]:'{:.1%}',birisk.columns[1]:'{:.1%}',birisk.columns[2]:'{:.2f}'})
| SPY corr | SPY cov | SPY beta | |
|---|---|---|---|
| SPY | 100.0% | 3.3% | 1.00 |
| VEA | 85.7% | 2.7% | 0.82 |
| UPRO | 99.9% | 10.0% | 2.99 |
| GLD | 10.6% | 0.3% | 0.09 |
| USO | 25.1% | 1.8% | 0.54 |
| FXE | 14.8% | 0.2% | 0.06 |
| BTC | 26.2% | 3.2% | 0.97 |
| HYG | 77.9% | 1.2% | 0.35 |
| IEF | -11.4% | -0.1% | -0.04 |
| TIP | 6.7% | 0.1% | 0.02 |
| SHV | -5.8% | -0.0% | -0.00 |
Multivariate Beta#
Beta as a rescaled correlation is helpful, but regression betas can be much more.
Consider a multivariate regression:
The OLS sample estimator of \(\beta\) is
noting that here \(\rmat\) denotes the matrix with columns of
ones,
\(r_{j,t}\)
\(r_{k,t}\)
That is, each row is an observation, \(t\), and each colmn is a variable, \((1, r_j, r_k)\).
COMPS = ['SPY','VEA']
betas = pd.DataFrame(dtype=float, columns=COMPS, index=rets.columns)
for sec in rets.columns:
    betas.loc[sec] = LinearRegression().fit(rets[COMPS],rets[[sec]]).coef_

betas.join(birisk['SPY beta']).rename(columns={'SPY beta': 'SPY (univariate)'}).style.format('{:.2f}')
| SPY | VEA | SPY (univariate) | |
|---|---|---|---|
| SPY | 1.00 | 0.00 | 1.00 |
| VEA | 0.00 | 1.00 | 0.82 |
| UPRO | 2.98 | 0.01 | 2.99 |
| GLD | -0.38 | 0.58 | 0.09 |
| USO | 0.41 | 0.16 | 0.54 |
| FXE | -0.27 | 0.41 | 0.06 |
| BTC | 0.53 | 0.54 | 0.97 |
| HYG | 0.24 | 0.14 | 0.35 |
| IEF | -0.11 | 0.08 | -0.04 |
| TIP | -0.06 | 0.10 | 0.02 |
| SHV | -0.00 | 0.00 | -0.00 |