


Optimizing Risk and Return#
Performance Measures#
We have discussed various measures of risk.
Of course, we care about return as well as risk.
We might be willing to take more risk for more return.
Below are measures of return and the risk-return tradeoff.
Excess Returns#
Many performance measures, as well as optimizations, will focus on excess returns. That is, the return on the portfolio /security beyond the risk-free rate.
We use tilde notation for excess returns to avoid writing the risk-free rate everywhere. That is,
Mean Return#
Mean (total or excess) return is the most utilized measure of ex-ante reward in an investment.
Most allocation and risk measures will consider mean return against some form of risk.
If we are focusing on USD, not returns, then we might label this as expected value (EV).
Alpha#
The second widely used measure of “reward” is alpha.
Consider a regression of the portfolio (or security) return against a benchmark, in this case, SPY.
Note that we might be interested in a decomposition against several factors, \(\boldsymbol{x}_t\).
We will have more to say about these decompositions.
Alpha as a measure of performance#
Alpha is measuring the mean return of the portfolio (security) beyond what can be explained by the regressors.
We may have a high mean return simply due to loading up on lots of factor risk.
Consider UPRO, the 3x levered S&P500 ETF.
For this reason, alpha is widely cited in judging (hedge / mutual) fund performance.
Did the fund earn high mean returns beyond what we would expect from their broad factor exposures?
In a sense, did we get any mean return beyond what we would have received from holding an (few?) index funds?
import pandas as pd
import numpy as np
import datetime

import matplotlib.pyplot as plt
%matplotlib inline
plt.rcParams['figure.figsize'] = (10,5)
plt.rcParams['font.size'] = 13
plt.rcParams['legend.fontsize'] = 13

from matplotlib.ticker import (MultipleLocator,
                               FormatStrFormatter,
                               AutoMinorLocator)

from sklearn.linear_model import LinearRegression
from cmds.portfolio import *
from cmds.risk import *
LOADFILE = '../data/risk_etf_data.xlsx'
info = pd.read_excel(LOADFILE,sheet_name='descriptions').set_index('ticker')
rets = pd.read_excel(LOADFILE,sheet_name='total returns').set_index('Date')
prices = pd.read_excel(LOADFILE,sheet_name='prices').set_index('Date')

retsx = rets.sub(rets['SHV'],axis=0)
FREQ = 252
AS_OF = rets.index.max()
doEXCESS = True
COMP = 'SPY'


if doEXCESS:
    data = retsx
else:
    data = rets


regs = pd.DataFrame(dtype=float, columns=['mean','alpha','beta'], index=rets.columns)
for sec in rets.columns:
    est = LinearRegression().fit(data[[COMP]],data[[sec]])
    regs.loc[sec,'alpha'] = est.intercept_
    regs.loc[sec,'beta'] = est.coef_[0]

regs['mean'] = retsx.mean()
regs[['mean','alpha']] *= FREQ
regs.style.format({'mean':'{:.2%}','alpha':'{:.2%}','beta':'{:.2f}'}).set_caption(f'Annualized results through {AS_OF:%Y-%m-%d}')
| mean | alpha | beta | |
|---|---|---|---|
| SPY | 13.60% | -0.00% | 1.00 |
| VEA | 9.19% | -1.92% | 0.82 |
| UPRO | 38.05% | -2.64% | 2.99 |
| GLD | 11.73% | 10.46% | 0.09 |
| USO | 7.11% | -0.25% | 0.54 |
| FXE | -1.06% | -1.87% | 0.06 |
| BTC | 63.17% | 50.01% | 0.97 |
| HYG | 2.41% | -2.40% | 0.35 |
| IEF | -0.88% | -0.30% | -0.04 |
| TIP | 0.51% | 0.22% | 0.02 |
| SHV | 0.00% | 0.00% | -0.00 |
Treynor#
The Treynor ratio is the tradeoff between mean excess return and beta.
This is mostly used with equities, where the beta is with regard to a broad equity benchmark, like SPY.
Information Ratio#
The Information Ratio is the tradeoff between alpha and unexplained volatility.
A regression of \(\rx_{i,t}\) onto a factor (benchmark) \(x_t\) reveals the unexplained…
mean: \(\alpha\)
movements: \(\epsilon\)
volatility: \(\sigma_\epsilon\) as well as the explained portion, \(\beta x\).
The Information Ratio is thus the Sharpe ratio of the unexplained portion of the decomposition, \(\alpha\) versus \(\epsilon\).
keyX = 'SPY'
tab = pd.concat([performanceMetrics(retsx,annualization=FREQ)['Sharpe'],get_ols_metrics(retsx[keyX],retsx,annualization=FREQ)[['Info Ratio','Treynor Ratio']]],axis=1)
tab = tab.apply(pd.to_numeric, errors='coerce')
tab.style.format({'alpha':'{:.2%}','Sharpe':'{:.2%}','r-squared':'{:.2%}','Treynor Ratio':'{:.2%}','Info Ratio':'{:.2%}'}).set_caption(f'Performance ratios through {AS_OF:%Y-%m-%d}')
| Sharpe | Info Ratio | Treynor Ratio | |
|---|---|---|---|
| SPY | 74.31% | nan% | 13.60% |
| VEA | 52.69% | -21.30% | 11.26% |
| UPRO | 69.43% | -104.03% | 12.72% |
| GLD | 72.45% | 64.99% | 125.90% |
| USO | 18.14% | -0.66% | 13.14% |
| FXE | -14.75% | -26.16% | -18.05% |
| BTC | 93.56% | 76.75% | 65.26% |
| HYG | 29.03% | -46.37% | 6.81% |
| IEF | -13.29% | -4.63% | 20.81% |
| TIP | 8.84% | 3.80% | 23.81% |
| SHV | nan% | nan% | nan% |
Diversification#
Subadditivity#
Variance of a Portfolio#
Consider a portfolio of \(\Nsec\) risky securities.
return volatility is \(\sigma_i\)
return covariance is \(\sigma_{i,j}\)
weight in security \(i\) is given by \(\wt_i\), with
\[\sum_{i=1}^\Nsec \wt_i = 1\]
Then
Suppose we have an equally-weighted portfolio, \(w_i=\frac{1}{\Nsec}\) for all \(i\).
Then it is easy to shwo that
As the portfolio increases the number of securities, \(\Nsec\to\infty\), we have
Individual variances do not have much impact on portfolio variance!#
Technical Points#
Equal weights?#
A similar result would hold even if we didn’t assume equal weights, so long as no single weight held a large share in the portfolio.
Simplified formula#
For pedagogy, assume all \(\Nsec\) volatilites are equal and that all pairwise correlations are \(\rho\). Then we would have
which makes the point that as \(\Nsec\) grows, the portfolio variance is a fraction of the common variance, where the fraction is given by \(\rho\).
This illustrates the idea of the total risk \(\sigma^2\) having two components
systematic, \(\rho\sigma^2\)
idiosyncratic
In more general settings, we see a similar phenomenon, that total risk decreases due to the subadditivity.
Stand-alone vs Marginal Risk#
More broadly, the risk measure of a single asset (standalone risk) is very different from its contribution of risk to a portfolio.
We saw this above for variance, but it is true for any subadditive risk measure.
Consider normal VaR, (recalling that general VaR is not subadditive.)
Normal Value-at-risk#
That is, the marginal VaR to portfolio \(p\) with \(\Nsec\) assets is a function of the covariances, not its own volatility.
Thus, marginal (normal) VaR is quite different from standalone (normal VaR).
Mean Additivity#
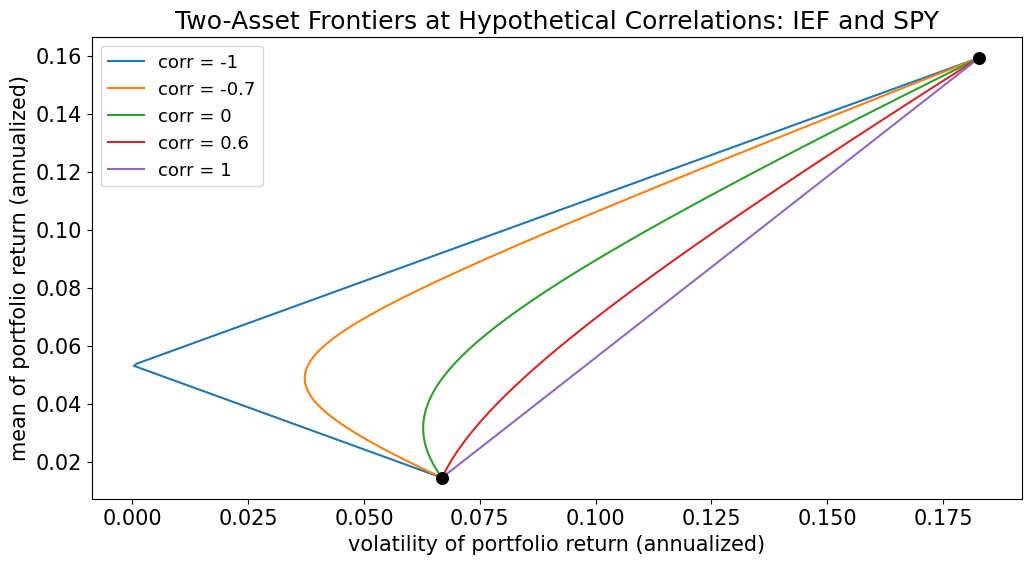
We have discussed subadditivity and diversification for risk. What about for mean return (reward)?
The mean is a linear function!
Thus, it is additive, not subadditive.
With means, the “whole” is exactly equal to the “sum of its parts.”
Thus, diversification reduces risk while leaving mean return intact!#
This is the reason that diversification is seen as a free lunch.
Example: Mean vs Volatility for Two Assets#
tickA, tickB = 'IEF', 'SPY'
muA, muB = rets[[tickA, tickB]].mean() * FREQ
volA, volB = rets[[tickA, tickB]].std() * np.sqrt(FREQ)

w = np.linspace(0, 1, 200)
fig, ax = plt.subplots()
for rho in [-1, -0.7, 0, 0.6, 1]:
    mu_p = w * muA + (1 - w) * muB
    vol_p = np.sqrt((w * volA)**2 + ((1 - w) * volB)**2 + 2 * w * (1 - w) * rho * volA * volB)
    ax.plot(vol_p, mu_p, label=f'corr = {rho}')
ax.scatter([volA, volB], [muA, muB], color='black', s=70, zorder=3)
ax.set_xlabel('volatility of portfolio return (annualized)')
ax.set_ylabel('mean of portfolio return (annualized)')
ax.set_title(f'Two-Asset Frontiers at Hypothetical Correlations: {tickA} and {tickB}')
ax.legend()
plt.show()
Mean-Variance Optimization#
For a target mean return, mean-variance optimization finds the portfolio with the smallest variance.
We first allow lending and borrowing in a risk-free asset and work with excess returns.
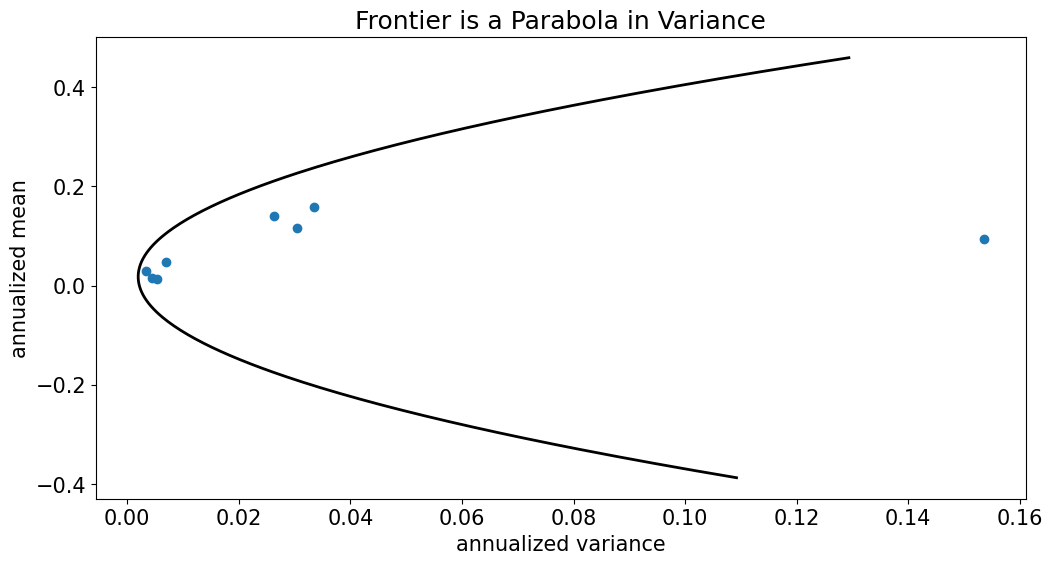
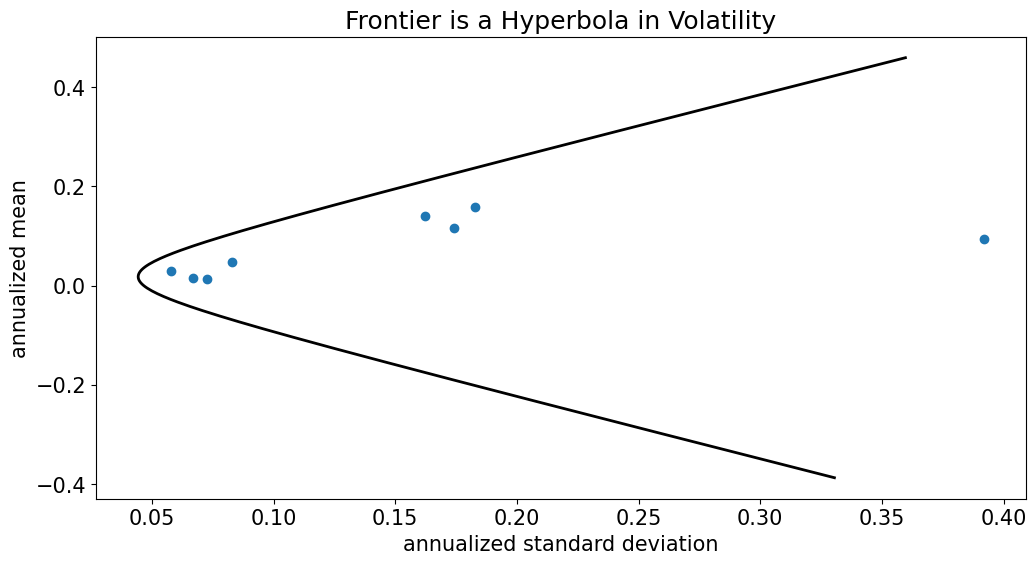
Figures on the Diversification#
# frontier universe: conventional assets (cash, BTC, UPRO excluded)
RISKY = rets.columns.drop(['SHV','BTC','UPRO'])
mu_r = rets[RISKY].mean().values * FREQ
Sig_r = rets[RISKY].cov().values * FREQ

def mv_frontier(mu, Sigma, m_grid):
    Si = np.linalg.inv(Sigma)
    ones = np.ones(len(mu))
    A = ones @ Si @ ones
    B = ones @ Si @ mu
    C = mu @ Si @ mu
    return (A * m_grid**2 - 2 * B * m_grid + C) / (A * C - B**2)

m_grid = np.linspace(mu_r.min() - 0.4, mu_r.max() + 0.3, 300)
var_grid = mv_frontier(mu_r, Sig_r, m_grid)

fig, ax = plt.subplots()
ax.plot(var_grid, m_grid, color='black', linewidth=2)
ax.scatter(np.diag(Sig_r), mu_r, zorder=3)
ax.set_xlabel('annualized variance')
ax.set_ylabel('annualized mean')
ax.set_title('Frontier is a Parabola in Variance')
plt.show()
fig, ax = plt.subplots()
ax.plot(np.sqrt(var_grid), m_grid, color='black', linewidth=2)
ax.scatter(np.sqrt(np.diag(Sig_r)), mu_r, zorder=3)
ax.set_xlabel('annualized standard deviation')
ax.set_ylabel('annualized mean')
ax.set_title('Frontier is a Hyperbola in Volatility')
plt.show()
Preliminaries#
Consider \(\Nsec\) risky assets with excess means \(\muxvec\) and positive-definite covariance matrix \(\covmat\).
The risk-free rate is constant over the investment period.
Risky weights \(\wtvec\) may be positive or negative and have no budget constraint.
The cash weight is \(1-\boldsymbol{1}'\wtvec\). A negative cash weight means borrowing.
Portfolio excess mean and variance are
Optimization#
For a target excess mean \(m\), solve
This is a convex quadratic program. The positive-definite covariance matrix gives a unique minimum. There are no restrictions on short positions or individual position sizes.
The solution#
Every target changes the scale of the same risky bundle. Its variance is
Assume at least one excess mean is nonzero. See MV Details for the derivation.
The tangency portfolio#
Normalize the risky bundle to weights summing to one:
When the denominator is positive, this is the risky portfolio with the highest Sharpe ratio. The investor combines it with cash; the mean target determines how much to hold.
Two-fund separation#
Investors hold the same tangency portfolio and cash in different proportions.
Lending reduces exposure to the risky bundle; borrowing increases it.
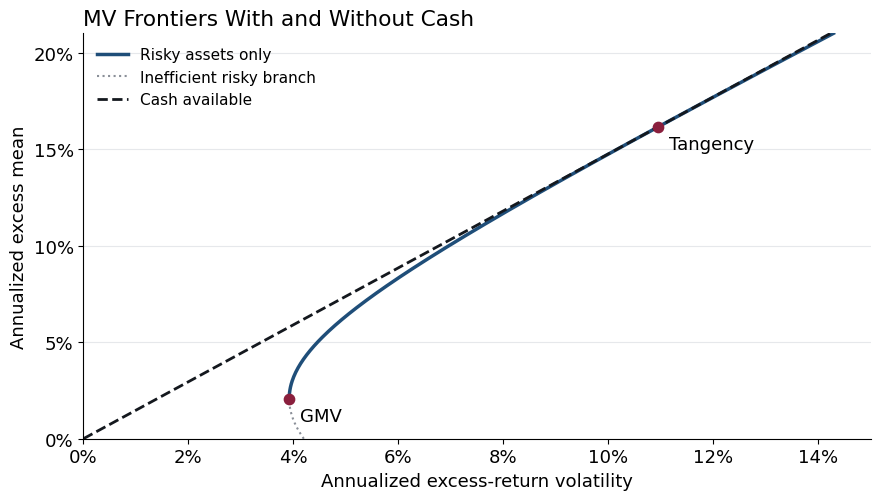
The efficient frontier is a straight line in mean-volatility space.
Additional Constraints#
No cash (weights add to one)#
Without a risk-free asset, all wealth must be allocated to risky assets. Use total-return means \(\boldsymbol{\mu}\); here \(m\) is the target total mean.
Define
The solution is
The target changes the mix of two risky funds, rather than the scale of one fund.
Minimum variance is \((Am^2-2Bm+C)/D\). The efficient branch starts at the GMV mean, \(B/A\).
Assume the asset means differ, so \(D>0\).
With a constant reference rate, subtracting it from asset means and the target leaves these fully invested weights unchanged. Excess-return notation does not require investing in cash.
MV Details derives the coefficients and two-fund representation.
Comparing the frontiers#
The Harvard case supplies ten risky ETFs, measured in excess of SHV. Both optimizations use the same excess-return means and covariance; the straight line allows a zero-excess-return cash position. This isolates the budget constraint.
Monthly returns, February 2011–July 2026. Annualized, in-sample estimates.
returns_cmp = pd.read_excel('../data/multi_asset_etf_data.xlsx',
                                sheet_name='total returns', index_col=0)
excess_cmp = returns_cmp.drop(columns=['QAI', 'SHV']).sub(returns_cmp['SHV'], axis=0).dropna()
mu_x = excess_cmp.mean().to_numpy() * 12
Sigma_cmp = excess_cmp.cov().to_numpy() * 12
Si_mu = np.linalg.solve(Sigma_cmp, mu_x)
Si_one = np.linalg.solve(Sigma_cmp, np.ones(len(mu_x)))
A = np.ones(len(mu_x)) @ Si_one
B_x = np.ones(len(mu_x)) @ Si_mu
C_x = mu_x @ Si_mu
D_x = A * C_x - B_x**2
assert B_x > 0 and D_x > 0

w_tan = Si_mu / B_x
mu_tan_x = C_x / B_x
vol_tan = np.sqrt(C_x) / B_x
mu_gmv_x, vol_gmv = B_x / A, np.sqrt(1 / A)
mean_upper = max(0.20, 1.3 * mu_tan_x)
means_upper = np.linspace(mu_gmv_x, mean_upper, 250)
means_lower = np.linspace(0, mu_gmv_x, 150)
frontier_vol = lambda m: np.sqrt((A*m**2 - 2*B_x*m + C_x) / D_x)
vol_max = max(frontier_vol(mean_upper), vol_tan) * 1.05
vol_line = np.linspace(0, vol_max, 200)

fig, ax = plt.subplots(figsize=(9, 5.2))
ax.plot(frontier_vol(means_upper), means_upper, color='#1f4e79', lw=2.5,
        label='Risky assets only')
ax.plot(frontier_vol(means_lower), means_lower, color='#8a8f98', lw=1.5,
        linestyle=':', label='Inefficient risky branch')
ax.plot(vol_line, np.sqrt(C_x)*vol_line, color='#14181e', lw=2,
        linestyle='--', label='Cash available')
ax.scatter([vol_gmv, vol_tan], [mu_gmv_x, mu_tan_x], color='#8a1f3d', s=55, zorder=4)
ax.annotate('GMV', (vol_gmv, mu_gmv_x), xytext=(8, -16), textcoords='offset points')
ax.annotate('Tangency', (vol_tan, mu_tan_x), xytext=(8, -16), textcoords='offset points')
from matplotlib.ticker import PercentFormatter
ax.xaxis.set_major_formatter(PercentFormatter(1, decimals=0))
ax.yaxis.set_major_formatter(PercentFormatter(1, decimals=0))
ax.set(xlim=(0, vol_max), ylim=(0, mean_upper),
       xlabel='Annualized excess-return volatility', ylabel='Annualized excess mean')
ax.set_yticks(np.arange(0, mean_upper + 0.001, 0.05))
ax.set_title('MV Frontiers With and Without Cash', loc='left')
ax.legend(frameon=False, loc='upper left', fontsize=11)
ax.spines[['top','right']].set_visible(False)
ax.grid(axis='y', color='#e6e8eb')
fig.tight_layout()
plt.show()
Position Constraints#
We may wish to constrain individual security weights, \(\wt_i\).
No short positions, \(\wt_i\ge 0\)
Mandate to hold at least/most, \(\wt_i\ge c\), \(\wt_j\le c\).
These constraints will cause us to lose an explicit solution formula.
Why?
Still, the optimization problem is easy numerically.
Why?
See the other notebook for an illustration of these constraints.
Beyond Variance#
These optimizations have been mean-variance.
We have discussed that there are many other risk measures we may want to consider.
What would be needed to optimize…
mean-volatility
mean-Normal VaR
information ratio
mean-to-VaR
mean-to-CVaR
Appendix#
One Weird Trick Your Statistician Will HATE#
Mean-variance optimization is actually a linear regression!
Look back at the formula for the tangency weights
\(\covmat\) is like \(X'X\)
\(\muxvec\) is like \(X'\boldsymbol{1}\)
Takes some tedious algebra, but can be shown that the tangency weights, (solving the MV problem) are obtained by the following, (weird!) regression:
Why do we care? The MV formula is easy to compute?
We can apply the many techniques and tricks of regression to portfolio optimization.
Extra Notebook#
See the appendix if interested in more on this.