


Solution - Barnstable and Long-Run Risk#
HBS Case#
The Risk of Stocks in the Long-Run: The Barnstable College Endowment#
| 1965–1999 | 2000–2025 | 1926–2025 | |||||
|---|---|---|---|---|---|---|---|
| Mean | Volatility | Mean | Volatility | Mean | Volatility | ||
| Levels | Market | 12.94% | 14.94% | 9.08% | 15.14% | 11.61% | 18.60% |
| Market excess | 6.79% | 15.01% | 7.26% | 15.16% | 8.43% | 18.63% | |
| T-bills | 6.15% | 0.72% | 1.83% | 0.56% | 3.18% | 0.84% | |
| Logs | Market | 11.76% | 14.96% | 7.90% | 15.23% | 9.85% | 18.53% |
| Market excess | 5.63% | 15.03% | 6.08% | 15.25% | 6.67% | 18.55% | |
| T-bills | 6.13% | 0.71% | 1.82% | 0.56% | 3.18% | 0.84% | |
Market underperforming T-bills over 15 years, using 1965–1999 estimates: 7.34%
Market underperforming T-bills over 30 years, using 1965–1999 estimates: 2.01%
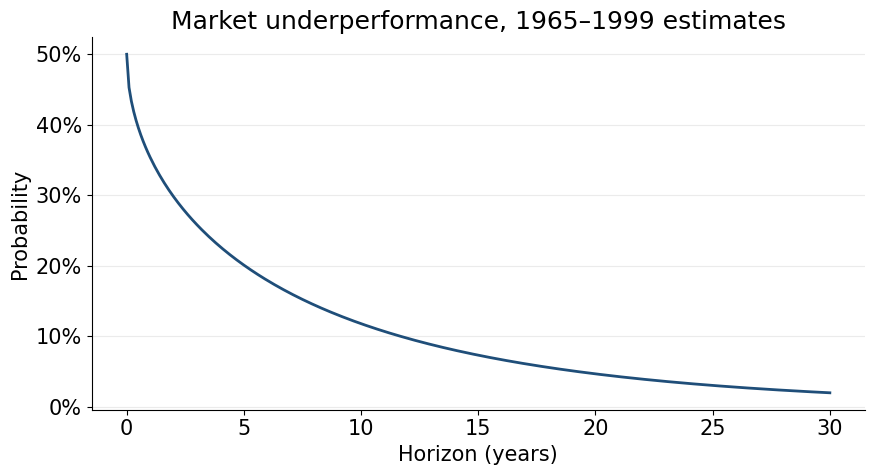
Market underperforming T-bills over 30 years, using 1965–2025 estimates: 1.74%
1965–1999 estimates for 2000–2025 (26 years):
Probability of a market return below the realized return: 9.43%