


Market Timing#
D/P is high. How much more of the market should you hold?
\(f_t\): forecast of next month’s excess return, \(\tilde r_{t+1}\).
\(\sigma_t^2\): conditional return variance; \(\gamma\): risk aversion.
At a given variance, a higher return forecast means a larger market position.
Horizon versus frequency: a longer-horizon forecast can still be updated when a new signal arrives. A persistent signal may imply similar positions across updates.
How Much to Tilt?#
Write the linear forecast as
\(\mu\), \(\sigma\): unconditional mean and volatility of excess returns.
\(z_t\): signal standardized to mean zero and standard deviation one.
\(R\): information coefficient (IC), the signal’s correlation with next month’s excess return.
\(S=\mu/\sigma\): market Sharpe ratio. IC and Sharpe use the same monthly horizon and sample.
With known conditional moments and constant conditional variance,
Relative tilt: \(\kappa\) is the position change per signal standard deviation, divided by the average position \(\bar w\).
Baseline matters: the same IC produces a larger proportional tilt when the market’s positive Sharpe ratio is lower.
Higher Sharpe need not mean a smaller absolute response: hold IC, volatility, and risk aversion fixed. Doubling the expected return doubles the average position and halves \(\kappa\). The absolute position change is unchanged.
Campbell–Thompson: for small predictive \(R^2\), at fixed risk aversion,
Here, \(R^2\) is the single-predictor regression’s in-sample \(R^2\), with an intercept.
A small \(R^2\) can matter when the baseline Sharpe ratio is also small.
This gain assumes known conditional moments. It excludes estimation error.
| R² | IC | Monthly SR | κ | Expected-return gain |
|---|---|---|---|---|
| 0.40% | 0.063 | 0.128 | 0.49 | 25% |
The 25% is a model-implied expected-return gain, not a 25% increase in Sharpe ratio.
Forecast Errors#
Returns: CRSP value-weighted market less the one-month Treasury; monthly, 1926–2026.
Signal: D/P, the trailing 12-month sum of monthly income returns.
Estimation: expanding OLS on lagged D/P; 20-year initial sample; forecasts from January 1947 through June 2026.
Numerator: the forecasting regression’s squared errors.
Denominator: squared errors from forecasting the expanding historical mean, \(\bar r_t\), known at the forecast date.
Negative \(R^2_{\mathrm{OOS}}\): the regression forecasts worse than this naive benchmark.
Forecast IC: correlation of \(f_t\) with \(\tilde r_{t+1}\) across forecast months. It can be negative and is not \(\sqrt{R^2_{\mathrm{OOS}}}\).
| Forecast IC | R² OOS |
|---|---|
| +0.076 | -0.58% |
Correlation and Calibration#
Suppose a forecast is always ten times the realized excess return:
IC = 1: perfect co-movement.
Large errors: a 1% return was forecast as 10%; the error is 9 percentage points.
Poor \(R^2_{\mathrm{OOS}}\): squared errors can exceed those of a naive forecast despite perfect correlation.
Calibration: if the tenfold scale error is known, divide the forecast by ten.
Position sizing: the original forecast produces ten times the position of the calibrated forecast under the same variance and risk aversion.
Sharpe ratio: a constant positive rescaling changes leverage and risk but leaves Sharpe unchanged under this unconstrained linear rule.
Feasible calibration: estimate it using information available before the next return. The forecast’s level and scale determine the position.
Reference: Empirical Results#
Realized Performance#
Data:
crsp_market_data.xlsx; the same CRSP/D/P sample used above.Both timing and historical-mean positions use the expanding variance of excess returns.
The common risk-aversion scale is omitted; it does not affect Sharpe ratios.
Floored D/P: set negative forecasts to zero, eliminating short market positions.
ΔSR: realized Sharpe minus buy-and-hold Sharpe.
SE of ΔSR: 2,000 paired bootstrap draws of months; both strategies use the same draws. This calculation does not preserve dependence across months.
| Strategy | R² OOS | IC | SR | ΔSR | SE of ΔSR |
|---|---|---|---|---|---|
| Buy and hold | 0.54 | ||||
| Historical mean | 0.51 | -0.035 | 0.015 | ||
| D/P timing | -0.58% | +0.076 | 0.45 | -0.087 | 0.129 |
| D/P floored at zero | -0.11% | +0.078 | 0.56 | +0.014 | 0.108 |
D/P timing underperforms buy-and-hold in this sample.
Flooring raises the realized Sharpe to 0.56, versus 0.54 for buy-and-hold. The difference is small relative to its standard error.
When D/P Helped#
Top: D/P forecast and expanding historical mean; monthly forecasts multiplied by 12.
Middle: D/P and its lowest value through 1990.
Bottom: cumulative squared-error improvement, divided by the historical mean’s total squared error. Its endpoint is \(R^2_{\mathrm{OOS}}\).
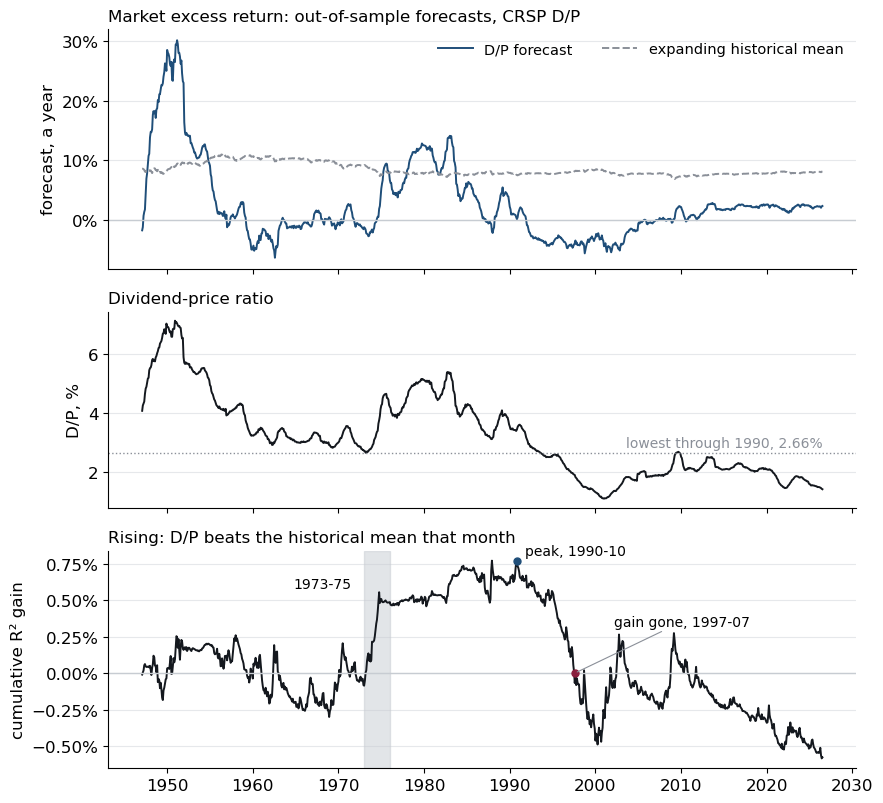
Most of D/P’s forecasting advantage comes from 1973–75.
From 1993, D/P falls below its pre-1991 low. The fitted line extrapolates to negative return forecasts and short market positions.
Forecast Level and Scale#
Forecast deviation: D/P forecast minus expanding historical mean.
Timing bet: return on the position difference between these strategies.
Information ratio (IR): the timing bet’s mean return divided by its volatility, annualized.
| Measure | Value |
|---|---|
| Average forecast deviation | -5.7% |
| Average D/P position / average benchmark position | 0.25 |
| Market excess return | 8.0% |
| Timing bet IR | -0.21 |
| Forecast-deviation SD | 6.7% |
| Deviation-return correlation × return SD | 4.1% |
Level: forecasts were too low, leaving the strategy underinvested in a rising market.
Scale: forecast deviations varied more than their correlation with returns supported.
OLS benchmark: in sample, with an intercept, fitted-value volatility equals fitted-value/return correlation times return volatility.
The fitted-value/return correlation is \(\sqrt{R^2}\). The raw signal’s correlation has the regression slope’s sign.
Model Details#
The Campbell–Thompson calculation assumes the forecast is the true conditional mean, with constant residual variance:
Absolute response: \(\bar w\kappa\) is the position change per signal standard deviation. It does not depend on \(\mu\).
Lower volatility: holding positive expected return, positive IC, and risk aversion fixed, lower volatility raises Sharpe and reduces the relative tilt, while increasing the absolute response.
Normalization: setting the average position to one gives \(w_t=1+\kappa z_t\). Maintaining that normalization as inputs change requires rescaling risk aversion.
The average squared conditional Sharpe ratio is
Expected timing return: \(S^{*2}/\gamma\).
Expected return on the constant position \(\mu/(\gamma\sigma^2)\): \(S^2/\gamma\).
Exact proportional expected-return gain: \(S^{*2}/S^2-1\).
\(S^{*2}\) averages conditional squared Sharpe ratios. It is not the realized strategy’s unconditional squared Sharpe ratio.
Sources#
Campbell and Thompson (2008), “Predicting Excess Stock Returns Out of Sample: Can Anything Beat the Historical Average?” Review of Financial Studies.
Goyal and Welch (2008), “A Comprehensive Look at the Empirical Performance of Equity Premium Prediction.” Review of Financial Studies.