


Comparing VaR Estimates#
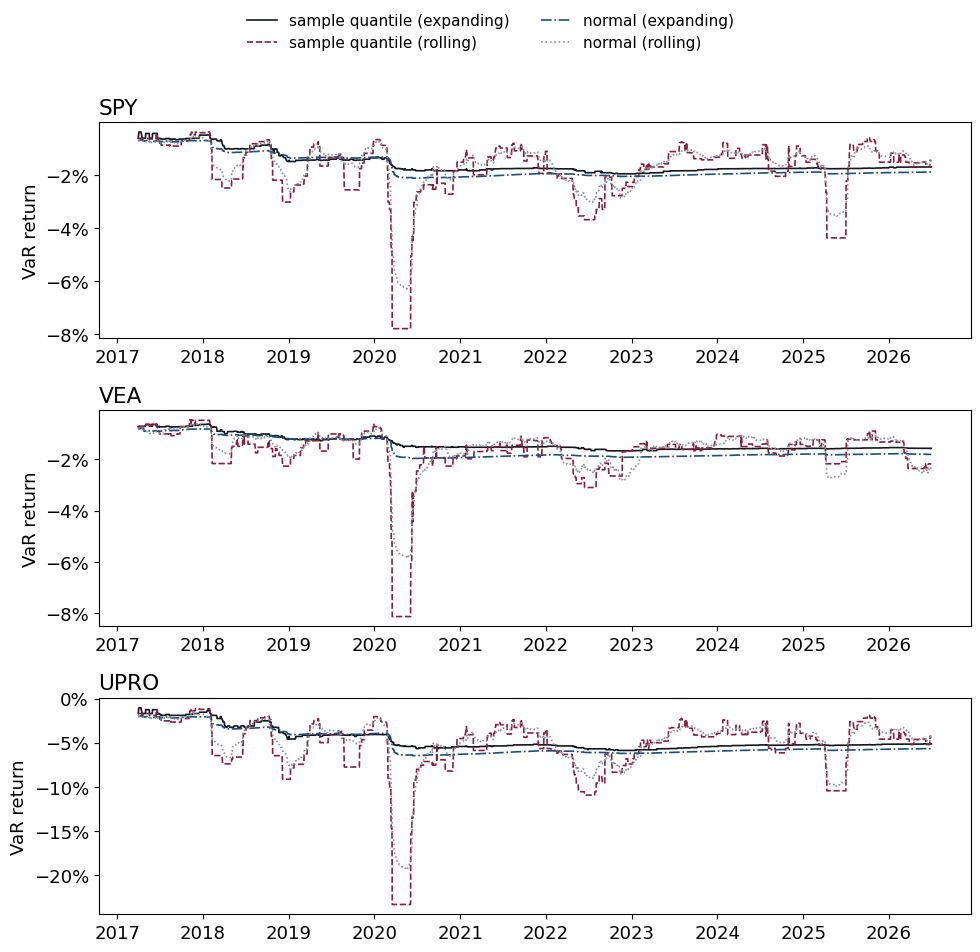
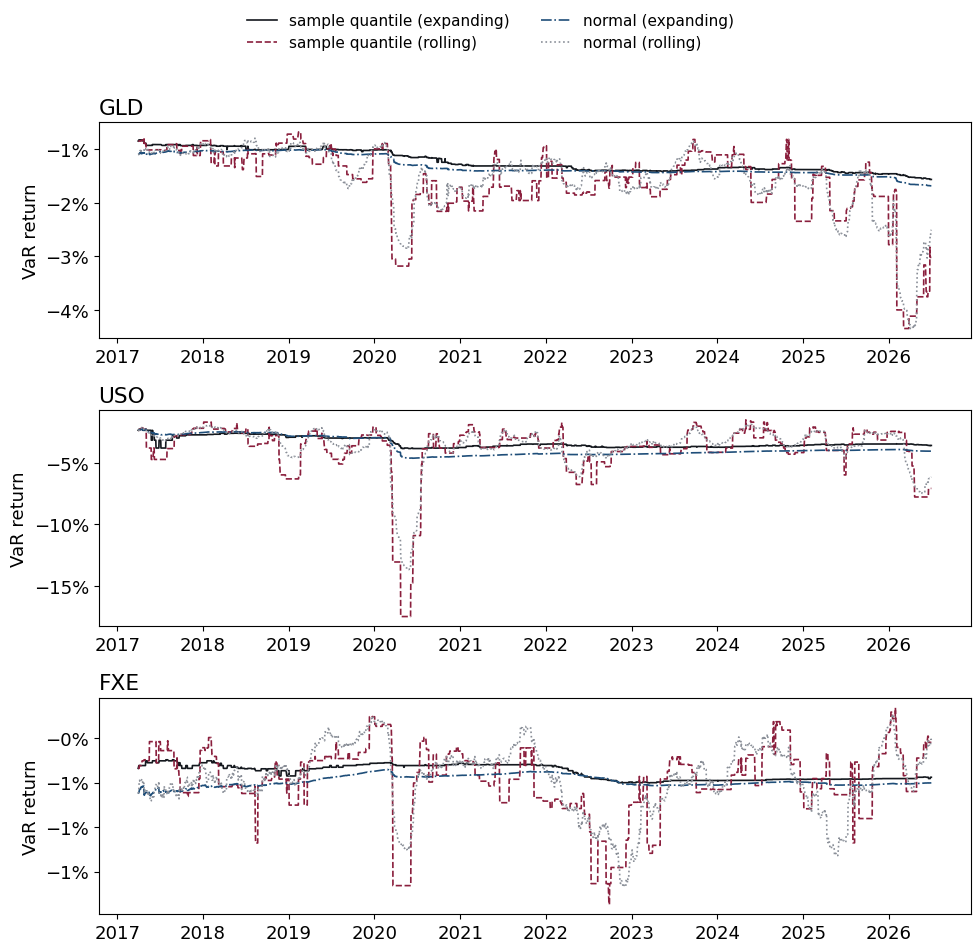
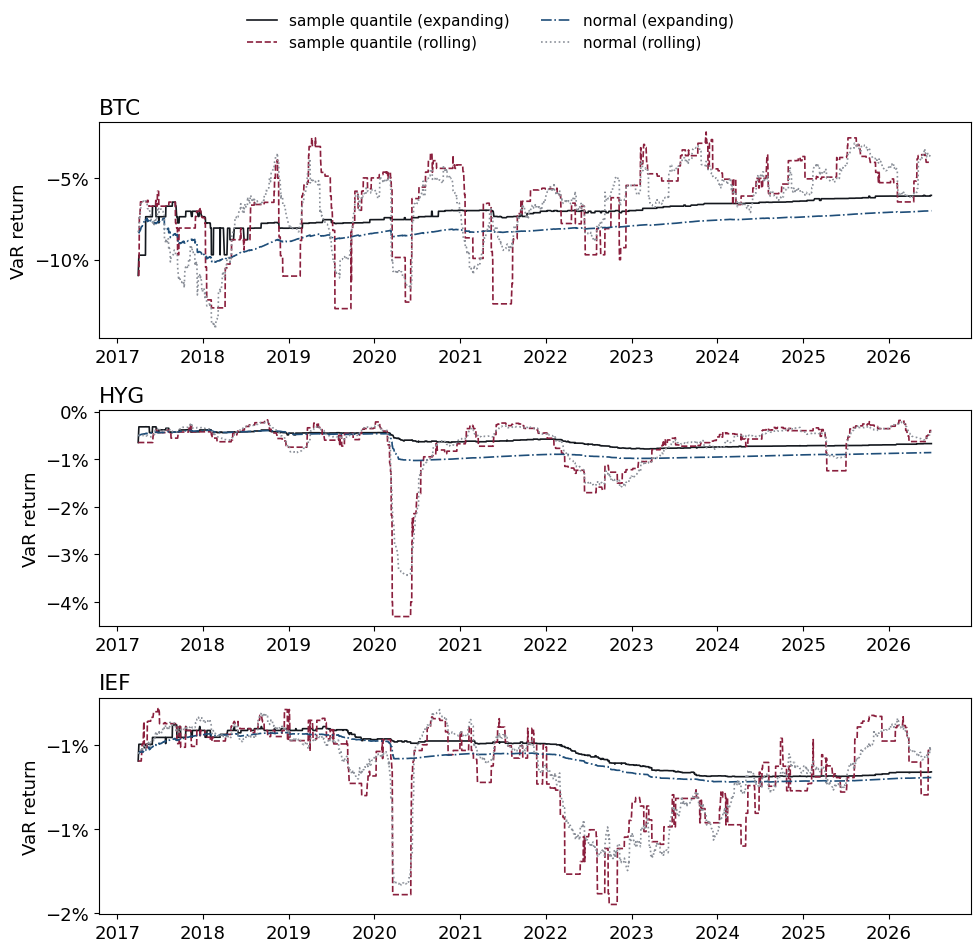
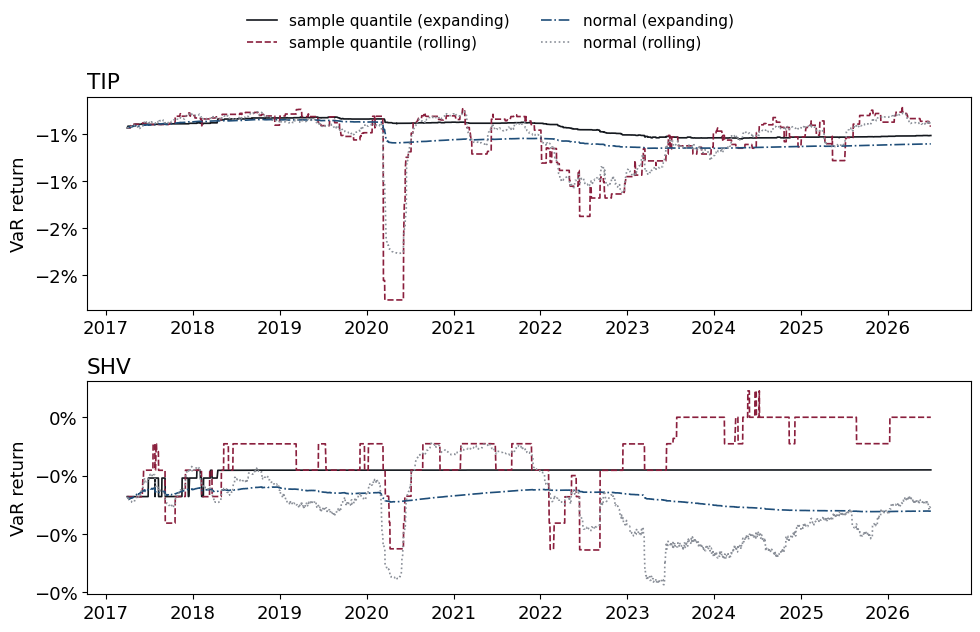
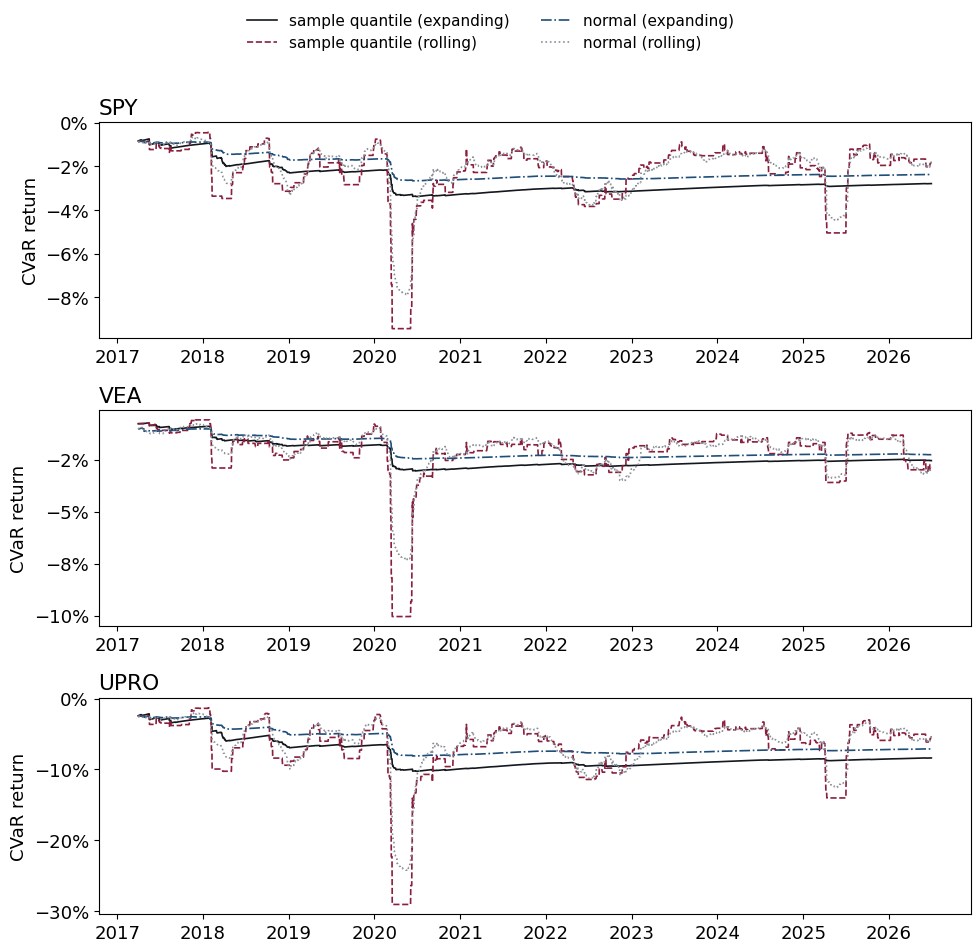
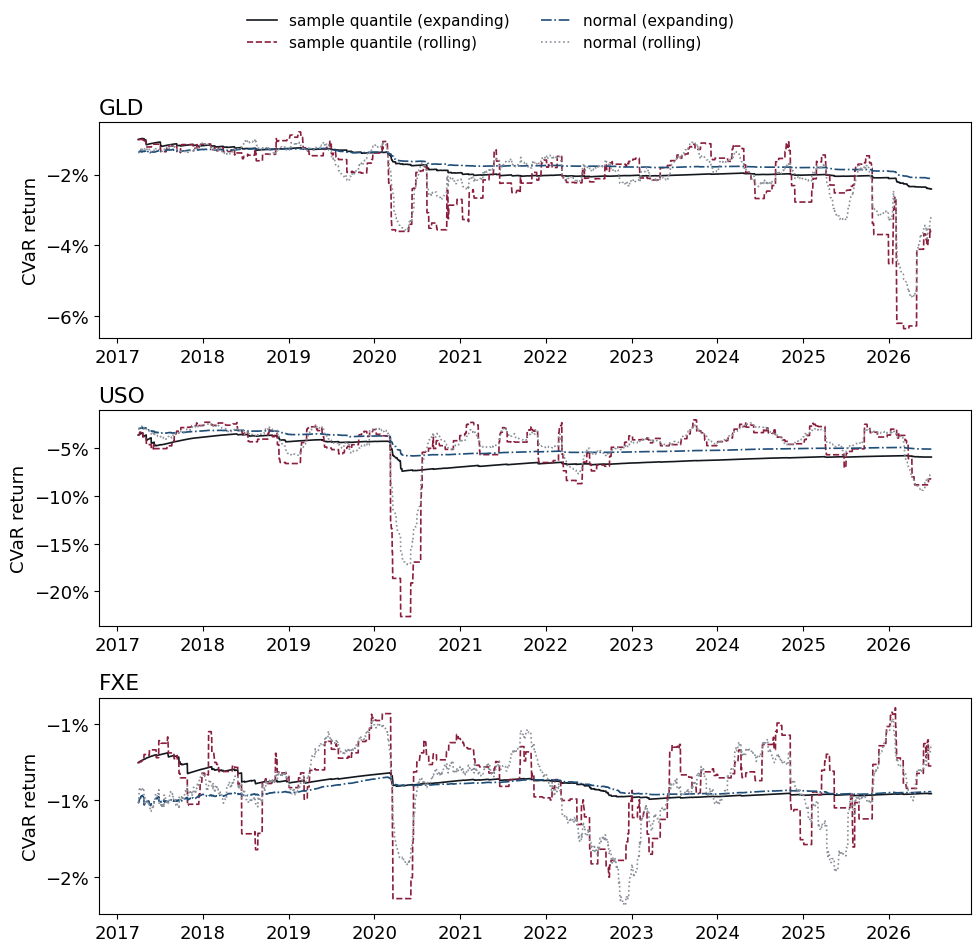
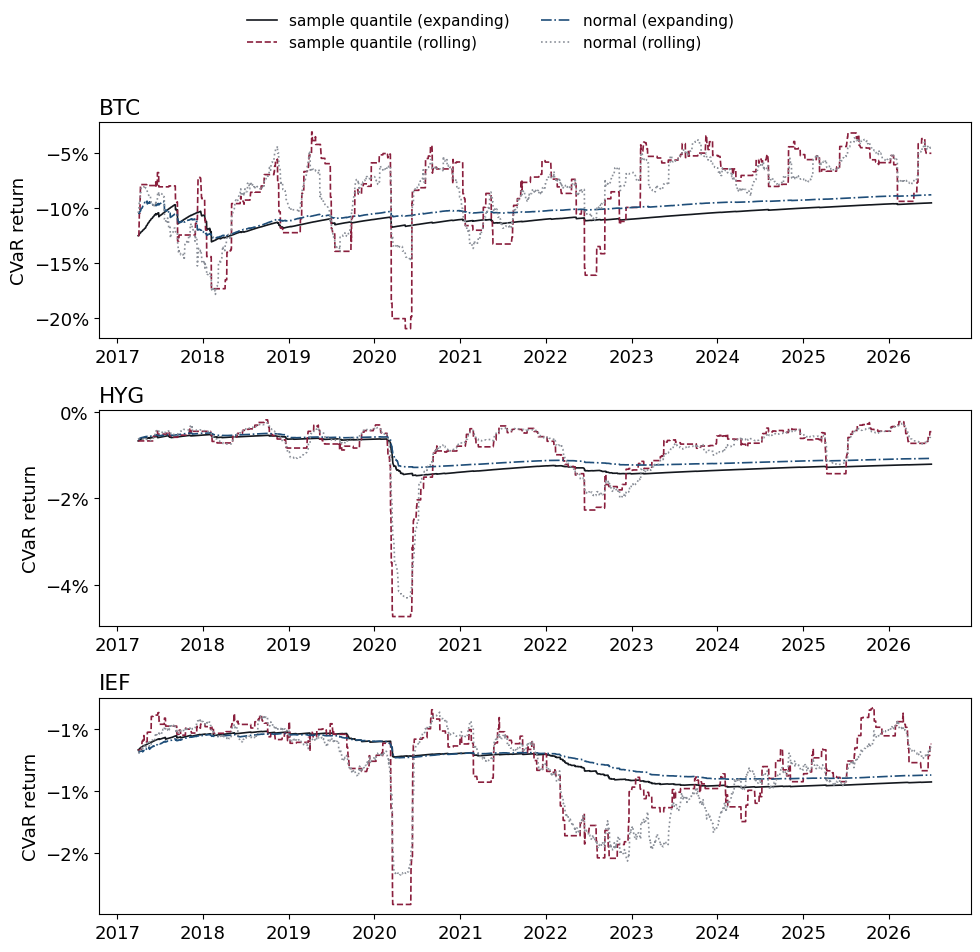
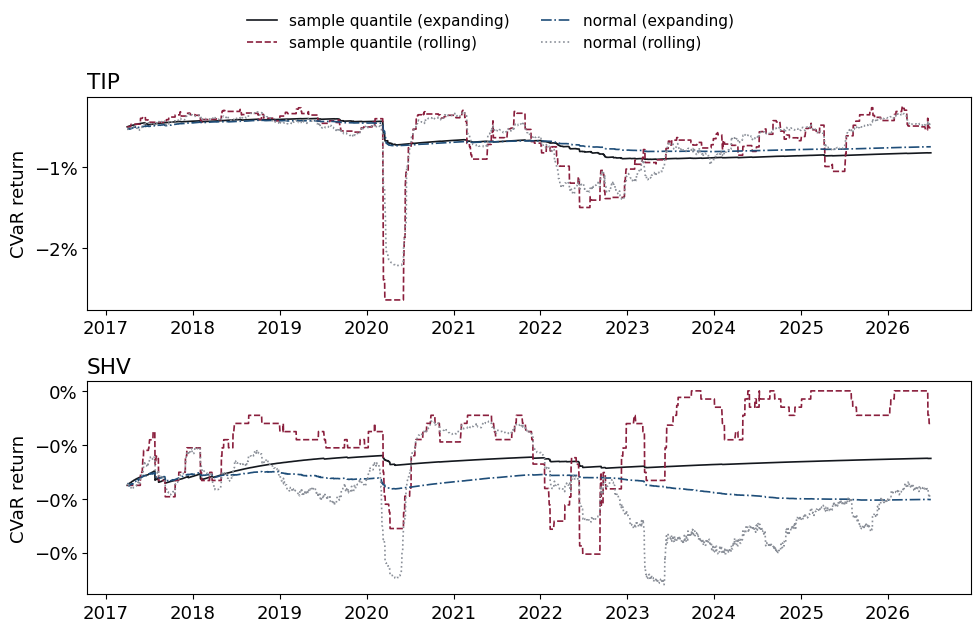
Compare sample-quantile and normal VaR forecasts using expanding and rolling windows. Each forecast uses returns observed before the forecast date.
import pandas as pd
import numpy as np
import matplotlib.pyplot as plt
from matplotlib.ticker import PercentFormatter
from scipy.stats import norm
%matplotlib inline
plt.rcParams['figure.figsize'] = (10, 5)
plt.rcParams['font.size'] = 13
plt.rcParams['legend.fontsize'] = 11

def tail_mean(values, q):
    """Mean of the lowest q probability mass of an empirical distribution."""
    x = np.sort(np.asarray(values, dtype=float))
    mass = q * len(x)
    whole = int(np.floor(mass))
    fraction = mass - whole
    total = x[:whole].sum()
    if fraction > 0:
        total += fraction * x[whole]
    return total / mass
LOADETF = '../data/risk_etf_data.xlsx'
px = pd.read_excel(LOADETF, sheet_name='prices').set_index('Date').dropna()
rets = px.pct_change(fill_method=None).dropna()

FREQ = 252
WINDOW = 60
QUANTILE = .05
mu = 0
Conditional Moments#
Conditional VaR uses information available at the forecast date. Under a normal model with zero mean, it depends on the conditional volatility forecast.
The Mean#
The normal forecasts below set the conditional mean to zero. The volatility formulas therefore use the second moment, \(\E[r^2]\).
Why might this approximation be useful for daily returns?
With a model for the mean, apply the volatility formulas to the demeaned returns and add the mean forecast when calculating VaR.
Forecast Timing#
\(\sigma_t^2\) denotes the variance forecast for day \(t\), using returns through \(t-1\). The formulas below assume a zero conditional mean.
Expanding Window#
Rolling Window#
EWMA#
The exponentially weighted moving average (EWMA) gives more weight to recent returns. For \(0<\lambda<1\),
Starting from \(\sigma_1^2\), the equivalent finite-history expression is
The initial variance and return weights sum to one.
GARCH#
For GARCH(1,1), \(\alpha_0>0\) and \(\alpha_1,\gamma_1\ge0\). The condition \(\alpha_1+\gamma_1<1\) gives a finite unconditional variance. Additional lags give higher-order GARCH models.
Comparing Forecasts#
Use daily ETF price returns for four forecasts:
Distribution estimate |
Expanding window |
Rolling window |
|---|---|---|
Sample quantile |
All prior returns |
Most recent returns |
Normal |
Expanding second moment; zero mean |
Rolling second moment; zero mean |
The setup table specifies the window and initial sample. All methods are evaluated on the same dates. EWMA and GARCH are defined above for comparison; the filtered-historical-simulation page applies GARCH.
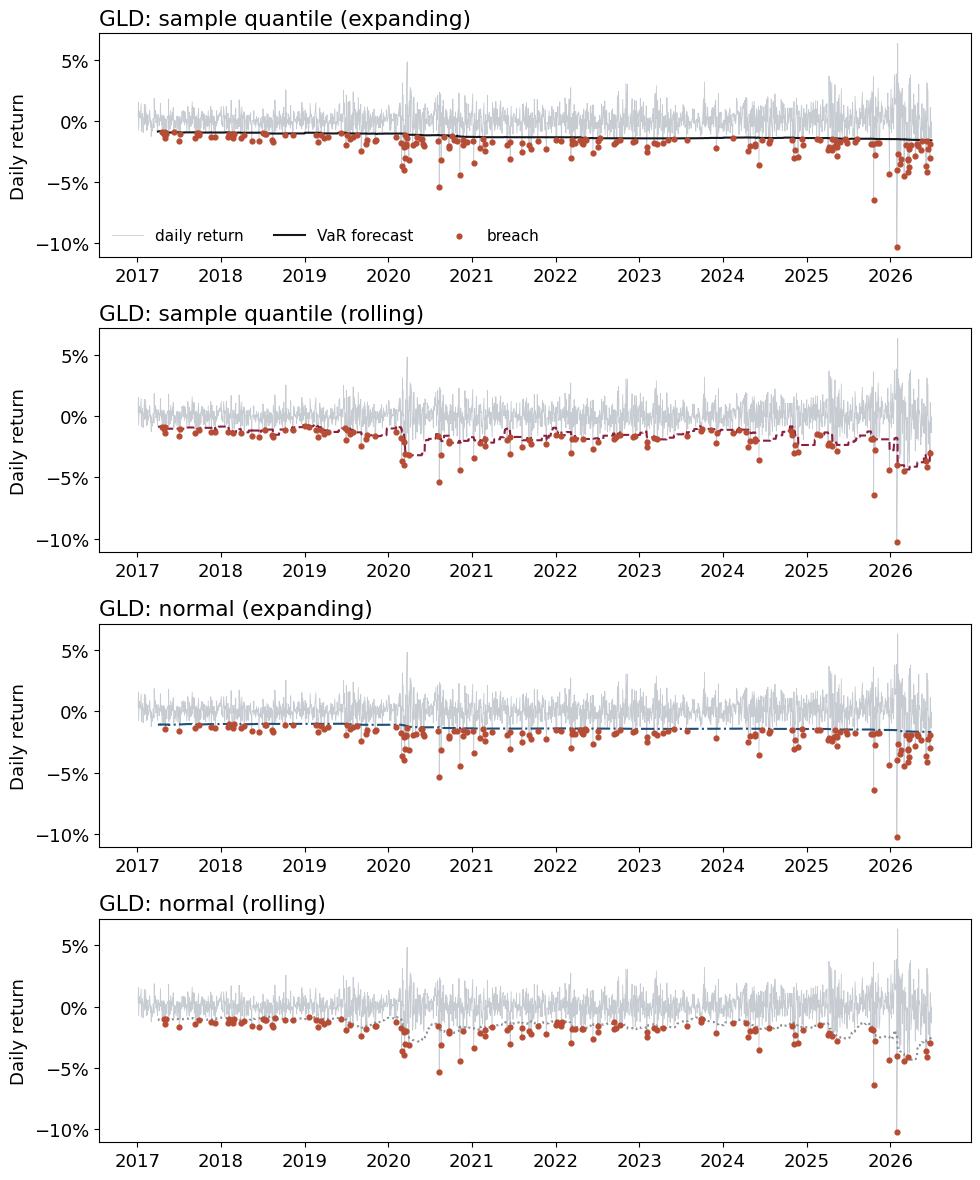
A breach occurs when the realized return falls below the forecast quantile. Compare breach rates with the target and inspect whether breaches cluster.
METHODS = ['sample quantile (expanding)', 'sample quantile (rolling)',
           'normal (expanding)', 'normal (rolling)']
COLORS = ['#14181e', '#8a1f3d', '#1f4e79', '#8a8f98']
STYLES = ['-', '--', '-.', ':']

sigma_expanding = np.sqrt(rets.pow(2).expanding(WINDOW).mean())
sigma_rolling = np.sqrt(rets.pow(2).rolling(WINDOW).mean())
setup = pd.DataFrame({'Rolling window, days': [WINDOW],
                      'Minimum history, days': [WINDOW],
                      'Target breach rate': [QUANTILE]})
display(setup.style.set_table_attributes('class="dataframe"').hide(axis='index').format(
    {'Rolling window, days': '{:,.0f}', 'Minimum history, days': '{:,.0f}',
     'Target breach rate': '{:.0%}'}, na_rep='').set_caption('Forecast setup'))
| Rolling window, days | Minimum history, days | Target breach rate |
|---|---|---|
| 60 | 60 | 5% |
sample_quantile = lambda x: np.quantile(x, QUANTILE, method='inverted_cdf')
sample_tail_mean = lambda x: tail_mean(x, QUANTILE)
zscore = norm.ppf(QUANTILE)

# Index each estimate by its target return date.
VaRret = {
    METHODS[0]: rets.expanding(WINDOW).apply(sample_quantile, raw=True).shift(1),
    METHODS[1]: rets.rolling(WINDOW).apply(sample_quantile, raw=True).shift(1),
    METHODS[2]: (mu + zscore*sigma_expanding).shift(1),
    METHODS[3]: (mu + zscore*sigma_rolling).shift(1),
}
CVaRret = {
    METHODS[0]: rets.expanding(WINDOW).apply(sample_tail_mean, raw=True).shift(1),
    METHODS[1]: rets.rolling(WINDOW).apply(sample_tail_mean, raw=True).shift(1),
    METHODS[2]: (mu - norm.pdf(zscore)/QUANTILE*sigma_expanding).shift(1),
    METHODS[3]: (mu - norm.pdf(zscore)/QUANTILE*sigma_rolling).shift(1),
}

# One asset per row keeps the four forecast series readable at book width.
for measure, estimates in [('VaR', VaRret), ('CVaR', CVaRret)]:
    for start in range(0, len(rets.columns), 3):
        tickers = rets.columns[start:start+3]
        fig, axes = plt.subplots(len(tickers), 1, figsize=(10, 3.2*len(tickers)),
                                 squeeze=False)
        for ax, tick in zip(axes[:, 0], tickers):
            for method, color, style in zip(METHODS, COLORS, STYLES):
                ax.plot(rets.index, estimates[method][tick], label=method,
                        color=color, ls=style, lw=1.2)
            ax.set_title(tick, loc='left')
            ax.set_ylabel(f'{measure} return')
            ax.yaxis.set_major_formatter(PercentFormatter(1, decimals=0))
        handles, labels = axes[0, 0].get_legend_handles_labels()
        fig.legend(handles, labels, loc='upper center', ncol=2, frameon=False)
        fig.tight_layout(rect=(0, 0, 1, .92))
        plt.show()
valid = rets.notna()
for method in METHODS:
    valid &= VaRret[method].notna()
hits = {method: (rets < VaRret[method]).astype(float).where(valid) for method in METHODS}
hitratio = pd.DataFrame({method: hits[method].sum()/valid.sum() for method in METHODS})

ax = hitratio.plot.bar(figsize=(10, 5), color=COLORS, rot=0)
ax.axhline(QUANTILE, color='#b64c33', ls='--', lw=1, label='target')
ax.set_title('VaR Breach Rates by Asset', loc='left')
ax.set_ylabel('Breach rate')
ax.yaxis.set_major_formatter(PercentFormatter(1, decimals=0))
ax.legend(loc='upper center', bbox_to_anchor=(.5, 1.28), ncol=2, frameon=False)
plt.show()

display(hitratio.style.set_table_attributes('class="dataframe"').format({m: '{:.1%}' for m in METHODS}, na_rep='').set_caption(
    'Breach rates on common forecast dates; target 5%'))
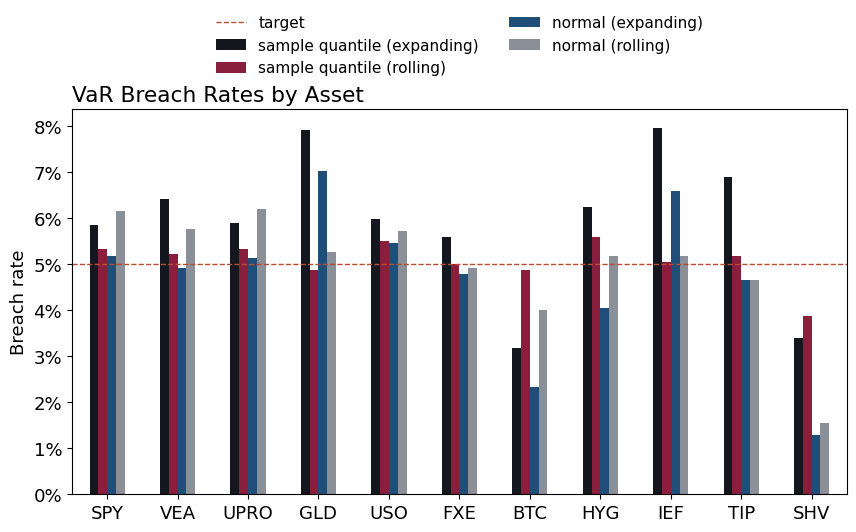
| sample quantile (expanding) | sample quantile (rolling) | normal (expanding) | normal (rolling) | |
|---|---|---|---|---|
| SPY | 5.9% | 5.3% | 5.2% | 6.2% |
| VEA | 6.4% | 5.2% | 4.9% | 5.8% |
| UPRO | 5.9% | 5.3% | 5.1% | 6.2% |
| GLD | 7.9% | 4.9% | 7.0% | 5.2% |
| USO | 6.0% | 5.5% | 5.5% | 5.7% |
| FXE | 5.6% | 5.0% | 4.8% | 4.9% |
| BTC | 3.2% | 4.9% | 2.3% | 4.0% |
| HYG | 6.2% | 5.6% | 4.0% | 5.2% |
| IEF | 8.0% | 5.0% | 6.6% | 5.2% |
| TIP | 6.9% | 5.2% | 4.6% | 4.6% |
| SHV | 3.4% | 3.9% | 1.3% | 1.5% |
# RMSE is in percentage points; lower values indicate closer average calibration.
calibration = pd.DataFrame({
    'Calibration RMSE, pp': np.sqrt(((hitratio-QUANTILE)**2).mean())*100,
    'Forecast days per asset': int(valid.sum().iloc[0]),
})
calibration.style.set_table_attributes('class="dataframe"').format({'Calibration RMSE, pp': '{:.2f}',
                         'Forecast days per asset': '{:,.0f}'}, na_rep='').set_caption(
    'Root mean squared breach-rate deviation across assets')
| Calibration RMSE, pp | Forecast days per asset | |
|---|---|---|
| sample quantile (expanding) | 1.73 | 2,324 |
| sample quantile (rolling) | 0.45 | 2,324 |
| normal (expanding) | 1.62 | 2,324 |
| normal (rolling) | 1.24 | 2,324 |
tick = 'GLD'
fig, axes = plt.subplots(len(METHODS), 1, figsize=(10, 12))
for ax, method, color, style in zip(axes, METHODS, COLORS, STYLES):
    forecast = VaRret[method][tick]
    breached = valid[tick] & (rets[tick] < forecast)
    ax.plot(rets.index, rets[tick], color='#c7ccd2', lw=.6, label='daily return')
    ax.plot(rets.index, forecast, color=color, ls=style, label='VaR forecast')
    ax.scatter(rets.index[breached], rets.loc[breached, tick],
               color='#b64c33', s=12, label='breach', zorder=3)
    ax.set_title(f'{tick}: {method}', loc='left')
    ax.set_ylabel('Daily return')
    ax.yaxis.set_major_formatter(PercentFormatter(1, decimals=0))
axes[0].legend(ncol=3, frameon=False)
fig.tight_layout()
plt.show()
Historical Simulation#
Historical simulation uses the empirical distribution of portfolio returns or losses. The sample quantile gives VaR without imposing a normal distribution.
An expanding window uses all available history. A rolling window limits the sample to recent observations. Neither explicitly models volatility dynamics; filtered historical simulation adds that adjustment.
CVaR#
Sort \(N\) observations from lowest to highest, \(r_{(1)},\ldots,r_{(N)}\). Let \(k=\lfloor qN\rfloor\) and \(a=qN-k\). The empirical lower-tail mean is
Omit the last term when \(a=0\). This averages exactly the worst \(q\) probability mass and handles a sample size for which \(qN\) is not an integer.
Sample Size#
The empirical distribution preserves observed skewness and tail outcomes. Its tail estimates depend on the number of observations near the quantile.
How many observations fall in the tail at the chosen probability and window?
Changing Distributions#
Longer windows provide more tail observations but may combine different market conditions. Shorter windows use more recent data and give less precise tail estimates.
Resampling individual dates treats historical shocks as exchangeable. Remaining serial dependence or changes in the shock distribution require additional modeling.
Monte Carlo Simulation#
Draw risk factors from a statistical model.
Revalue the portfolio under each draw.
Calculate VaR and CVaR from the simulated PnL distribution.
Simulation permits nonlinear valuation and dynamics without requiring a closed-form distribution for portfolio PnL.
Bonds and Options#
Simulate stock prices and other option-pricing inputs, then revalue the options at the shorter remaining maturity.
Simulate yield-curve changes, then reprice each bond’s cash flows.
Other Distribution Models#
Student’s t. Allows heavier tails than a normal distribution. Forecast performance depends on the fitted parameters and volatility model.
Extreme value theory. Models tail behavior beyond a chosen threshold.
Quantile regression. Estimates a conditional quantile directly from predictors.