


LFD for Dimension Reduction#
With more stocks than weekly observations, the sample covariance matrix is singular. We decompose S&P 500 stock returns using sector ETFs as factors.
The Panel#
import pandas as pd
import numpy as np
import matplotlib.pyplot as plt
from matplotlib.ticker import PercentFormatter
from matplotlib.colors import LinearSegmentedColormap
from sklearn.decomposition import PCA
from IPython.display import display
%matplotlib inline
plt.rcParams['figure.figsize'] = (10, 5)
plt.rcParams['font.size'] = 15

FREQ = 52

stocks = pd.read_excel('../data/spx_returns_weekly_legacy_2025.xlsx',
                       sheet_name='s&p500 rets').set_index('date')
sectors = pd.read_excel('../data/sector_etf_data.xlsx',
                        sheet_name='total returns').set_index('date')

# Use the same complete observations and stocks for both factor models.
dates = stocks.index.intersection(sectors.dropna().index)
stocks = stocks.loc[dates].dropna(axis=1)
F = sectors.loc[dates]

panel = pd.Series({
    'Stocks': stocks.shape[1],
    'Sector factors': F.shape[1],
    'Weekly observations': len(dates),
    'First date': dates.min().strftime('%Y-%m-%d'),
    'Last date': dates.max().strftime('%Y-%m-%d'),
}, name='Sample')
panel.to_frame().style.format(na_rep='').set_caption('The estimation panel')
| Sample | |
|---|---|
| Stocks | 442 |
| Sector factors | 11 |
| Weekly observations | 361 |
| First date | 2018-06-29 |
| Last date | 2025-05-23 |
Sector ETF Factors#
The sector ETFs provide tradable factor exposures. For stock \(i\), let \(r_{i,t}\) denote its return and \(f_t\) the vector of sector ETF returns:
The intercept is \(\alpha_i\), the factor loadings are \(\beta_i\), and \(\epsilon_{i,t}\) is the residual. We estimate a separate regression for each stock.
Let \(B\) collect the loading vectors \(\beta_i\) as columns. OLS gives the sample covariance relation
where \(\Sigma_f\) is the factor covariance matrix and \(\Sigma_\epsilon\) is the residual covariance matrix. Approximating \(\Sigma_\epsilon\) by the diagonal matrix \(D\) of residual variances gives
We then estimate factor covariances, stock loadings, and residual variances. The diagonal approximation drops residual covariances. Its adequacy depends on portfolio exposures.
def fit_factors(returns, factors):
    X = np.column_stack([np.ones(len(factors)), factors.values])
    coef = np.linalg.lstsq(X, returns.values, rcond=None)[0]
    residuals = pd.DataFrame(returns.values - X @ coef,
                             index=returns.index, columns=returns.columns)
    r2 = 1 - residuals.var() / returns.var()
    return coef[0], coef[1:], residuals, r2

alpha, B, E, R2 = fit_factors(stocks, F)

# Keep the same exposure-based ordering in every heatmap.
groups = pd.Series(F.columns[np.abs(B).argmax(axis=0)], index=stocks.columns)
ordered = pd.DataFrame({'ETF': groups, 'Stock': stocks.columns}).sort_values(['ETF', 'Stock'])
stock_order = ordered.index
sizes = ordered.groupby('ETF', sort=False).size()
group_ticks = sizes.cumsum().to_numpy() - sizes.to_numpy() / 2 - 0.5


def pairwise(df):
    corr = df.corr().to_numpy()
    return corr[np.triu_indices_from(corr, k=1)]


def mean_abs_corr(df):
    return np.abs(pairwise(df)).mean()


def heatmap(df, title):
    corr = df.loc[:, stock_order].corr().to_numpy()
    corr = np.ma.array(corr, mask=np.eye(len(corr), dtype=bool))
    fig, ax = plt.subplots(figsize=(8.5, 7.5), layout='constrained')
    cmap = LinearSegmentedColormap.from_list(
        'correlation', plt.get_cmap('RdBu_r')(np.linspace(0.45, 1, 256)))
    im = ax.imshow(corr, cmap=cmap, vmin=-0.1, vmax=1,
                   interpolation='nearest', aspect='equal')
    ax.set_xticks(group_ticks, sizes.index, rotation=90)
    ax.set_yticks(group_ticks, sizes.index)
    ax.tick_params(axis='both', labelsize=13)
    ax.set_xlabel('Stocks grouped by ETF loading')
    ax.set_title(title, loc='left')
    fig.colorbar(im, ax=ax, shrink=0.8, label='Correlation',
                 extend='min', ticks=[-0.1, 0, 0.25, 0.5, 0.75, 1],
                 format=PercentFormatter(1, decimals=0))
    plt.show()


def show_fit(r2):
    fig, ax = plt.subplots(layout='constrained')
    ax.hist(r2, bins=np.linspace(0, 1, 41), color='gray', alpha=0.75)
    ax.axvline(r2.median(), color='black', lw=2, label='Median')
    ax.set_xlim(0, 1)
    ax.xaxis.set_major_formatter(PercentFormatter(1))
    ax.set_xlabel('Regression $R^2$')
    ax.set_ylabel('Stocks')
    ax.legend()
    plt.show()
    fit = pd.Series({
        'Mean': r2.mean(),
        'Median': r2.median(),
        f'Minimum ({r2.idxmin()})': r2.min(),
        f'Maximum ({r2.idxmax()})': r2.max(),
    }, name='Explained variance')
    display(fit.to_frame().style.format({'Explained variance': '{:.1%}'}, na_rep='')
            .set_caption('Regression fit across stocks'))


def show_correlations(residuals):
    summary = pd.DataFrame({
        'Mean absolute correlation': [mean_abs_corr(stocks), mean_abs_corr(residuals)]
    }, index=['Returns', 'Residuals'])
    display(summary.style.format({'Mean absolute correlation': '{:.1%}'}, na_rep='')
            .set_caption('Unique stock pairs, excluding the diagonal'))


def show_risk(residuals):
    vol_r = stocks.std() * np.sqrt(FREQ)
    vol_e = residuals.std() * np.sqrt(FREQ)
    lim = [0, 1.04 * vol_r.max()]
    fig, ax = plt.subplots(figsize=(7.5, 6), layout='constrained')
    ax.plot(lim, lim, color='black', lw=1, ls='--', label='No reduction')
    ax.scatter(vol_r, vol_e, s=18, color='gray', alpha=0.6)
    ax.xaxis.set_major_formatter(PercentFormatter(1))
    ax.yaxis.set_major_formatter(PercentFormatter(1))
    ax.set_xlim(lim)
    ax.set_ylim(lim)
    ax.set_xlabel('Annualized return volatility')
    ax.set_ylabel('Annualized residual volatility')
    ax.legend()
    plt.show()
    shape = pd.DataFrame({
        'Returns': [vol_r.mean(), stocks.skew().mean(), stocks.kurtosis().mean()],
        'Residuals': [vol_e.mean(), residuals.skew().mean(), residuals.kurtosis().mean()],
    }, index=['Annualized volatility', 'Skewness', 'Excess kurtosis'])
    display(shape.T.style.format({'Annualized volatility': '{:.1%}', 'Skewness': '{:.2f}',
                                  'Excess kurtosis': '{:.2f}'}, na_rep='')
            .set_caption('Cross-sectional averages'))


def cumulative_variance(df):
    p = PCA(svd_solver='full').fit(df)
    return p.explained_variance_ratio_.cumsum()


raw_pca = PCA(svd_solver='full').fit(stocks)
cv_raw = raw_pca.explained_variance_ratio_.cumsum()


def show_concentration(residuals):
    cv_resid = cumulative_variance(residuals)
    n = min(20, len(cv_raw), len(cv_resid))
    grid = np.arange(1, n + 1)
    fig, ax = plt.subplots(layout='constrained')
    ax.plot(grid, cv_raw[:n], color='black', lw=2, marker='o', ms=4,
            label='Stock returns')
    ax.plot(grid, cv_resid[:n], color='#b64c33', lw=2, ls='--', marker='s', ms=4,
            label='Residuals')
    ax.set_xlim(1, n)
    ax.set_ylim(0, 1)
    ax.set_xticks(grid[::2])
    ax.yaxis.set_major_formatter(PercentFormatter(1))
    ax.set_xlabel('Principal components')
    ax.set_ylabel('Cumulative variance explained')
    ax.legend()
    plt.show()
    cuts = np.array([i for i in (1, 3, 10, 20) if i <= n])
    summary = pd.DataFrame({'Returns': cv_raw[cuts - 1], 'Residuals': cv_resid[cuts - 1]},
                           index=['PC1' if i == 1 else f'First {i}' for i in cuts])
    display(summary.style.format({'Returns': '{:.1%}', 'Residuals': '{:.1%}'}, na_rep='')
            .set_caption('Share of each panel’s total variance'))
Explained Variance#
The regression \(R^2\) measures the share of a stock’s return variance explained by the factors.
show_fit(R2)
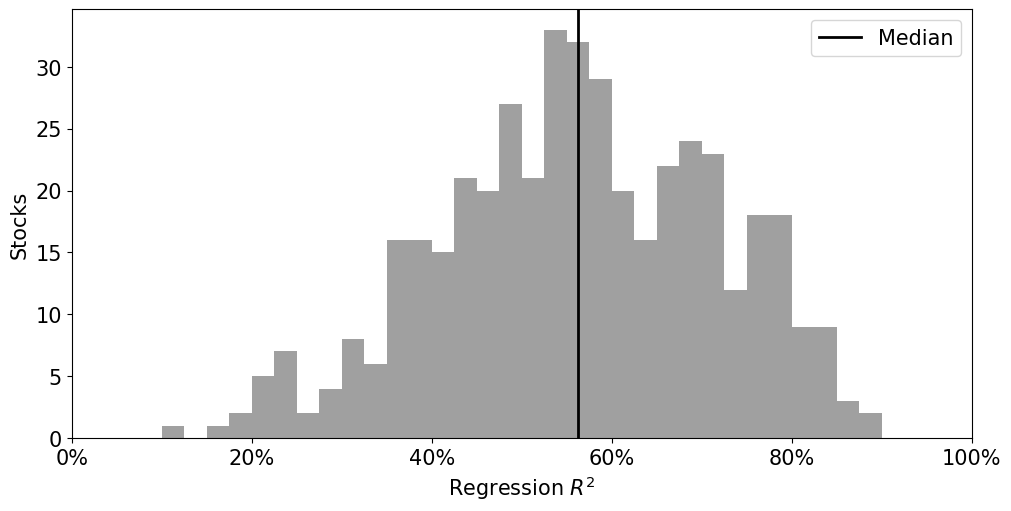
| Explained variance | |
|---|---|
| Mean | 56.3% |
| Median | 56.2% |
| Minimum (ERIE) | 12.2% |
| Maximum (XOM) | 89.8% |
Pairwise Correlations#
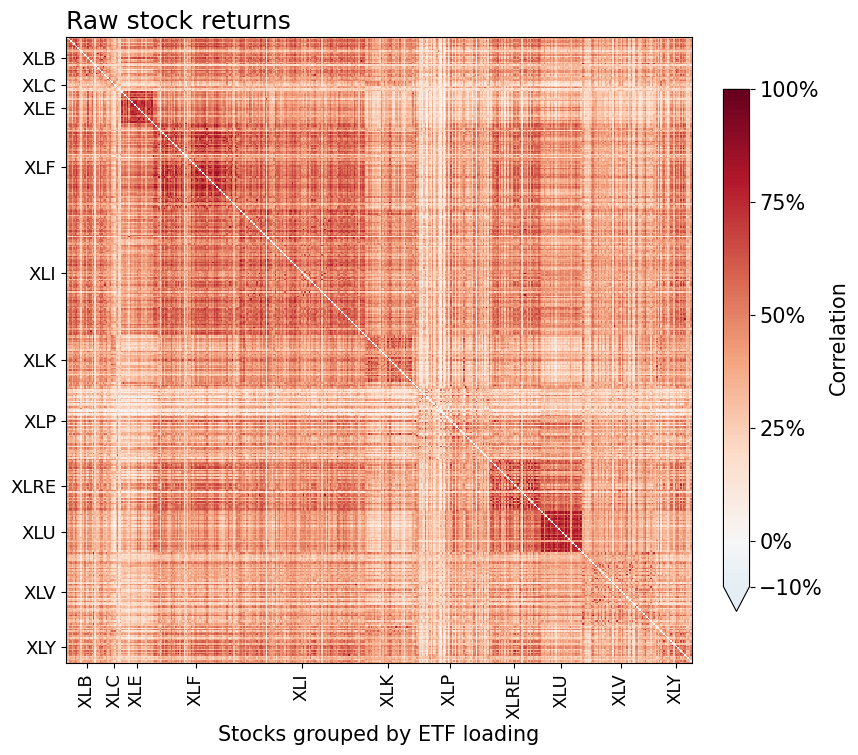
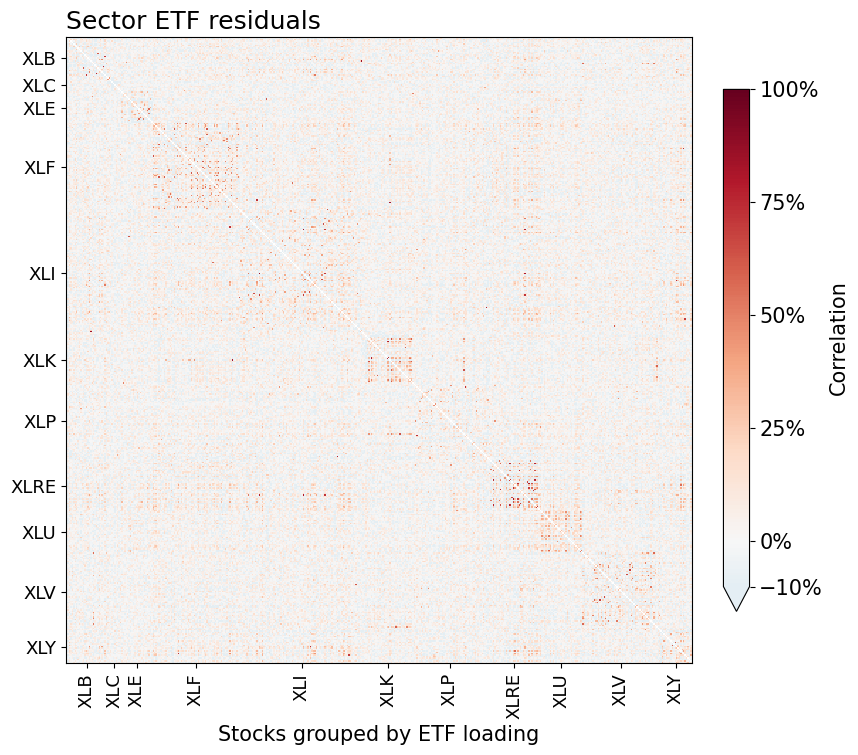
Stocks are grouped by the sector ETF with the largest absolute fitted loading, then alphabetically within each group. All heatmaps use this ordering and the same color scale. The diagonal is omitted.
Values below −10% share the lower-limit color. The correlation quantiles report the full range.
heatmap(stocks, 'Raw stock returns')
heatmap(E, 'Sector ETF residuals')
show_correlations(E)
| Mean absolute correlation | |
|---|---|
| Returns | 39.0% |
| Residuals | 6.7% |
The mean uses absolute correlations so positive and negative values cannot cancel. A small mean absolute correlation does not establish independence or rule out concentrated residual exposures.
Residual Risk#
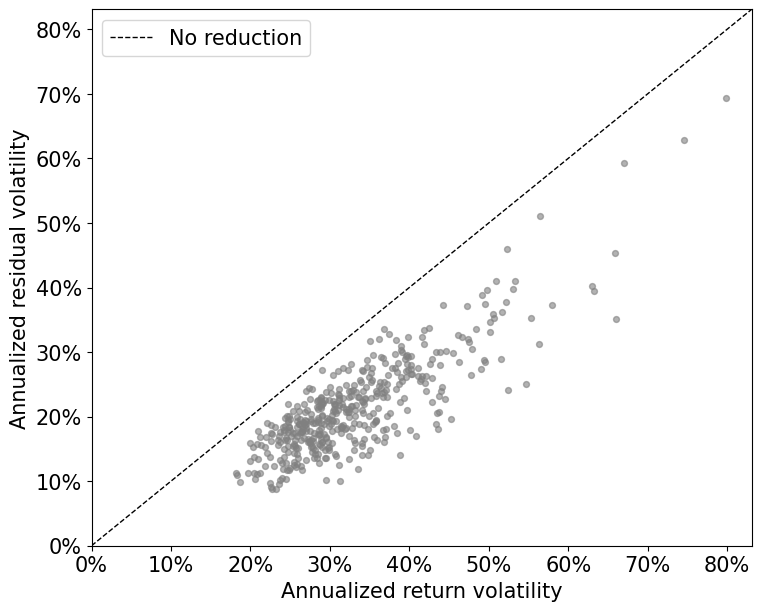
OLS reduces in-sample variance by construction. The comparison measures the remaining variation.
show_risk(E)
| Annualized volatility | Skewness | Excess kurtosis | |
|---|---|---|---|
| Returns | 33.1% | 0.00 | 5.46 |
| Residuals | 21.6% | 0.08 | 4.37 |
Substantial excess kurtosis remains after removing sector exposures. Near-zero average skewness can mask skewness in individual stocks.
Variance Concentration#
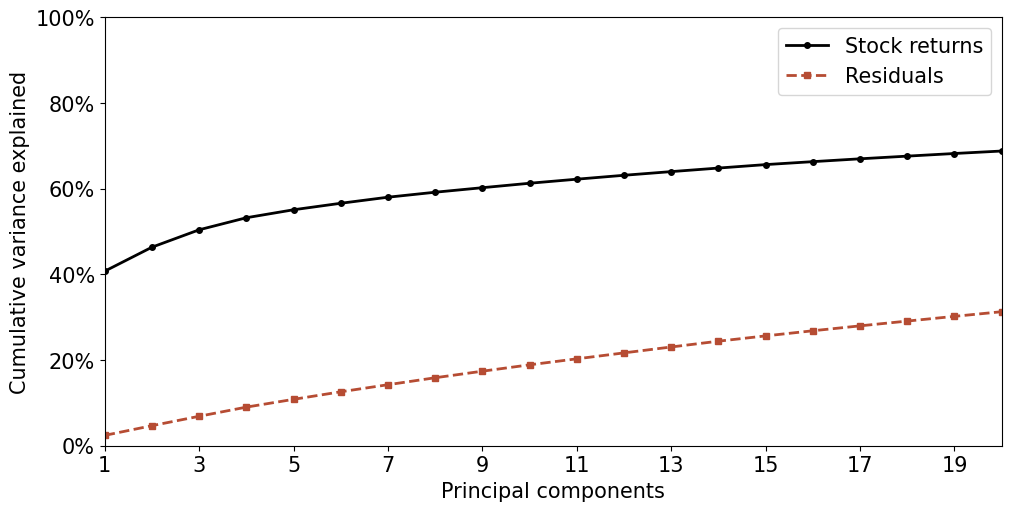
Principal component analysis (PCA) forms uncorrelated linear combinations, ordered by variance. We demean each series without scaling its volatility, so this is PCA of the covariance matrix.
Here, PCA diagnoses the concentration of variance in returns and residuals. The regression factors are still sector ETFs. Each curve divides by the total variance of its own panel.
show_concentration(E)
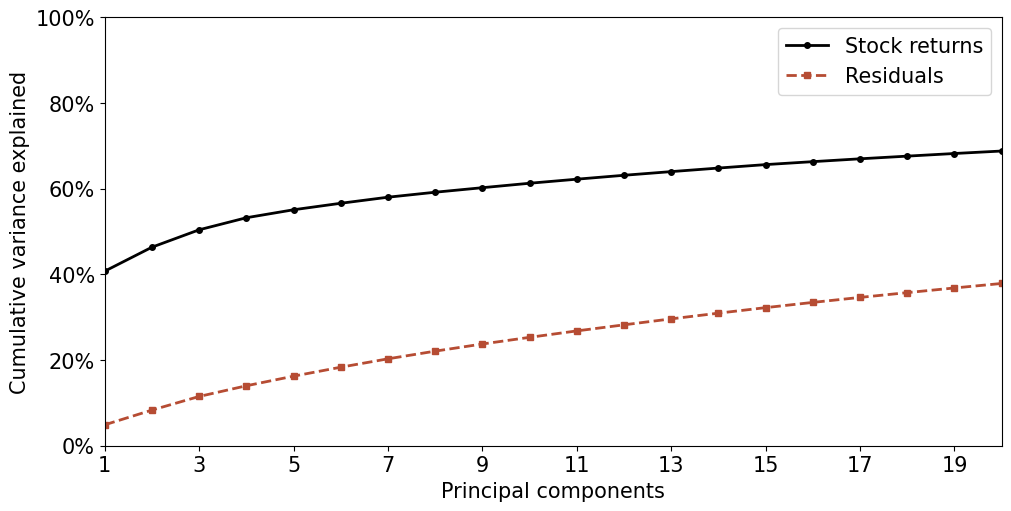
| Returns | Residuals | |
|---|---|---|
| PC1 | 40.7% | 4.9% |
| First 3 | 50.4% | 11.5% |
| First 10 | 61.3% | 25.3% |
| First 20 | 68.8% | 37.9% |
PCA Factors#
PCA can also supply the factors. Let \(r_t\) be the vector of stock returns and \(\bar r\) its sample mean. If \(v_j\) is the unit eigenvector associated with the \(j\)th largest eigenvalue of the return covariance matrix, the factor score is
We retain the same number of principal components as sector ETFs and use these scores in the same stock regressions and covariance decomposition.
PCA chooses the linear combinations that capture the most total variance in this sample for the given factor count. The factors are estimated from the stocks being explained. We continue to use demeaned returns without volatility scaling.
K = F.shape[1]
F_pca = pd.DataFrame(raw_pca.transform(stocks)[:, :K], index=stocks.index,
                     columns=[f'PC{i}' for i in range(1, K + 1)])
alpha_pca, B_pca, E_pca, R2_pca = fit_factors(stocks, F_pca)

pd.DataFrame({'Factors': [F.shape[1], F_pca.shape[1]]},
             index=['Sector ETFs', 'PCA']).style.format(
    {'Factors': '{:.0f}'}, na_rep=''
).set_caption('Factor counts')
| Factors | |
|---|---|
| Sector ETFs | 11 |
| PCA | 11 |
Explained Variance#
Apply the same regression fit measures to the PCA factors.
show_fit(R2_pca)
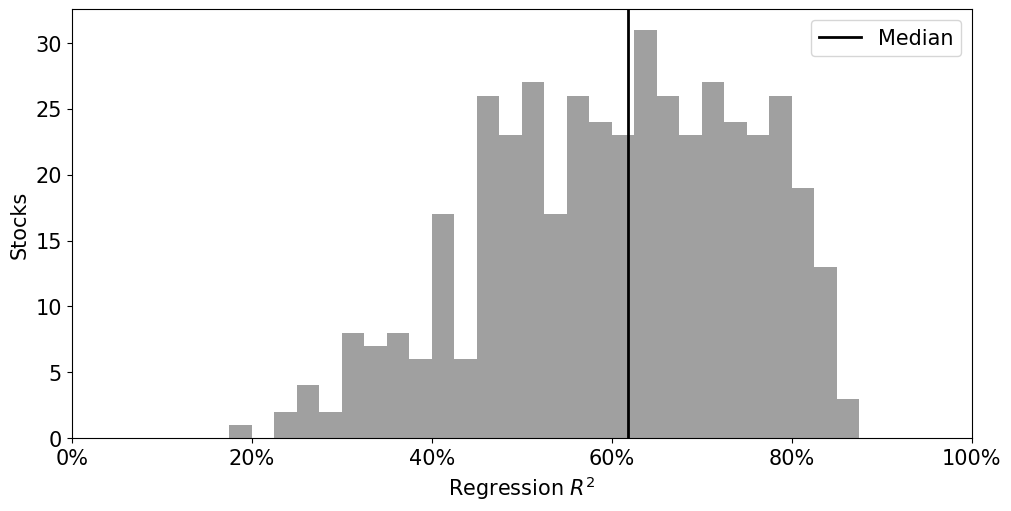
| Explained variance | |
|---|---|
| Mean | 60.5% |
| Median | 61.8% |
| Minimum (ERIE) | 18.2% |
| Maximum (PRU) | 87.2% |
Pairwise Correlations#
Stock residual correlations after removing PCA factors. Ordering and color scale match the earlier heatmaps.
heatmap(E_pca, 'PCA residuals')
show_correlations(E_pca)
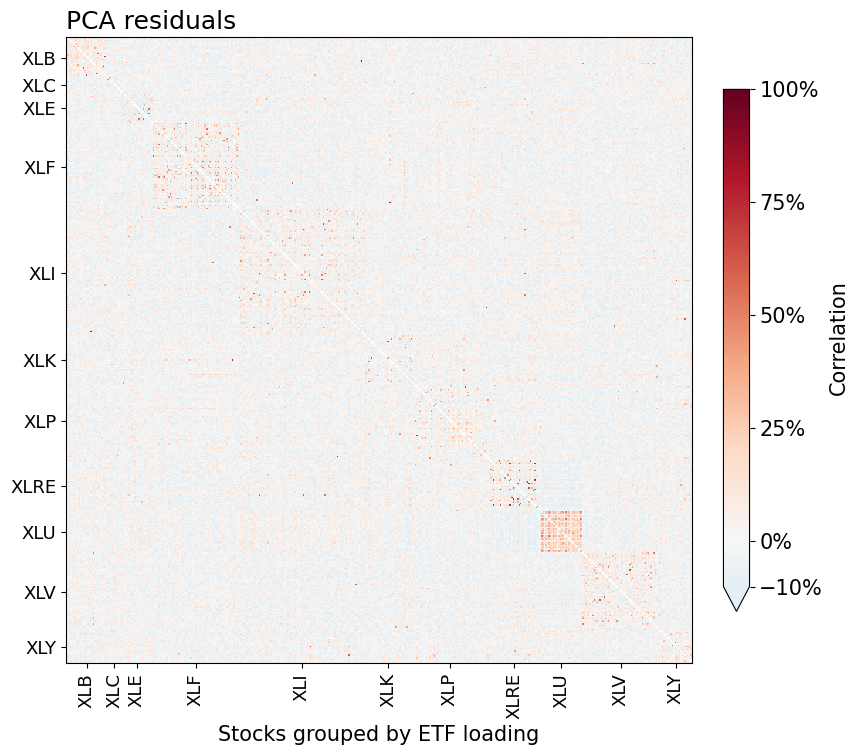
| Mean absolute correlation | |
|---|---|
| Returns | 39.0% |
| Residuals | 5.8% |
Uncorrelated PCA factors do not imply uncorrelated stock residuals.
Residual Risk#
show_risk(E_pca)
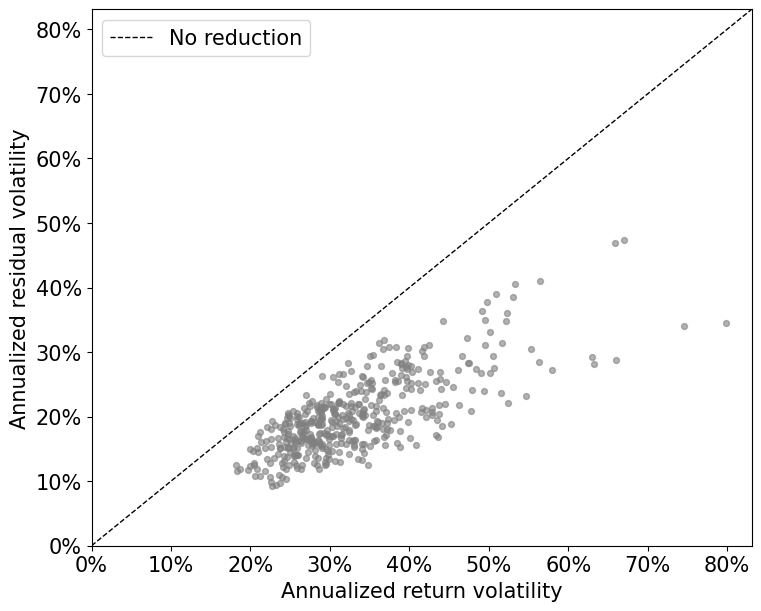
| Annualized volatility | Skewness | Excess kurtosis | |
|---|---|---|---|
| Returns | 33.1% | 0.00 | 5.46 |
| Residuals | 20.2% | 0.02 | 4.17 |
Variance Concentration#
Fit PCA to the remaining residuals to measure how concentrated their variance is. Each curve again uses its own panel’s total variance as the denominator.
show_concentration(E_pca)
| Returns | Residuals | |
|---|---|---|
| PC1 | 40.7% | 2.4% |
| First 3 | 50.4% | 6.9% |
| First 10 | 61.3% | 18.9% |
| First 20 | 68.8% | 31.3% |
Factor Comparison#
Mean stock \(R^2\) weights stocks equally. The share of total variance explained weights them by their return variance, which is the criterion PCA maximizes.
The correlation column compares raw returns with residuals from each factor model.
comparison = pd.DataFrame({
    'Raw returns': [np.nan, np.nan, mean_abs_corr(stocks)],
    'Sector ETFs': [R2.mean(), 1 - E.var().sum() / stocks.var().sum(), mean_abs_corr(E)],
    'PCA': [R2_pca.mean(), 1 - E_pca.var().sum() / stocks.var().sum(), mean_abs_corr(E_pca)],
}, index=['Mean stock R²', 'Total variance explained', 'Mean absolute correlation'])
comparison.T.style.format({'Mean stock R²': '{:.1%}', 'Total variance explained': '{:.1%}',
                           'Mean absolute correlation': '{:.1%}'}, na_rep='')\
    .set_caption('In-sample factor comparison')
| Mean stock R² | Total variance explained | Mean absolute correlation | |
|---|---|---|---|
| Raw returns | 39.0% | ||
| Sector ETFs | 56.3% | 55.5% | 6.7% |
| PCA | 60.5% | 62.2% | 5.8% |
Pairwise Correlation Range#
Signed correlations across unique stock pairs, excluding the diagonal. The quantiles use the full correlations, including values below the heatmap scale.
quantiles = pd.DataFrame({
    'Raw returns': np.quantile(pairwise(stocks), [0, 0.25, 0.5, 0.75, 1]),
    'Sector residuals': np.quantile(pairwise(E), [0, 0.25, 0.5, 0.75, 1]),
    'PCA residuals': np.quantile(pairwise(E_pca), [0, 0.25, 0.5, 0.75, 1]),
}, index=['0% (minimum)', '25%', '50% (median)', '75%', '100% (maximum)'])
quantiles.index.name = 'Percentile'
quantiles.style.format({
    'Raw returns': '{:.1%}', 'Sector residuals': '{:.1%}', 'PCA residuals': '{:.1%}'
}, na_rep='').set_caption('Signed pairwise correlation quantiles')
| Raw returns | Sector residuals | PCA residuals | |
|---|---|---|---|
| Percentile | |||
| 0% (minimum) | -12.1% | -45.2% | -38.3% |
| 25% | 29.0% | -4.5% | -5.0% |
| 50% (median) | 39.2% | 0.8% | -0.4% |
| 75% | 49.0% | 6.3% | 4.3% |
| 100% (maximum) | 94.6% | 86.0% | 83.6% |
Notes#
Sample. Requiring observations for all sector ETFs limits the sample to the history available for
XLC. Only stocks with complete returns over this window are retained.Estimation. Both models use the full sample. The calculations treat fitted loadings as fixed and omit estimation uncertainty. PCA’s in-sample variance advantage does not establish better out-of-sample covariance forecasts.
Volatility modeling. VaR by Filtered Historical Simulation fits GARCH models to the sector factors and resamples factor shocks and stock residuals jointly by date. It leaves residuals unscaled by a volatility model. Low cross-sectional correlation does not establish constant residual volatility. That notebook uses daily data and re-estimates its own loadings.