Inflation#
import pandas as pd
import warnings
#warnings.filterwarnings('ignore')

import matplotlib.pyplot as plt
%matplotlib inline
plt.rcParams['figure.figsize'] = (12,6)
plt.rcParams['font.size'] = 15
plt.rcParams['legend.fontsize'] = 13
from matplotlib.ticker import StrMethodFormatter
rawdata = pd.read_excel('../data/economic_data.xlsx',sheet_name='data').set_index('date')

FREQ = 4

if FREQ == 4:
    FREQcode = 'Q'
elif FREQ == 1:
    FREQcode = 'Y'
elif FREQ==12:
    FREQcode = 'M'

data = rawdata.resample(FREQcode).agg('last')
data.index = data.index - pd.tseries.offsets.BDay(1)

data_econ = data
/var/folders/zx/3v_qt0957xzg3nqtnkv007d00000gn/T/ipykernel_27142/4082269214.py:12: FutureWarning: 'Q' is deprecated and will be removed in a future version, please use 'QE' instead.
  data = rawdata.resample(FREQcode).agg('last')
Economic Aggregates#
The dual mandate#
The Fed has a dual mandate
price stability
full employment
There is a lot of controversey around how the Fed should specifically measure and prioritize these dual goals.
Traditionally, a view that economic growth and output are related.
Accordingly, tension in keeping inflation low while also stimulating the economy.
In particular, there is controversey about
How forcefully should the Fed act with monetary policy to reduce and control inflation?
Their primary tool is to raise interest rates.
Should they risk recession to control inflation?
The data#
The plots below give context about the economy, especially measured discussed relative to interest rates and the Fed.
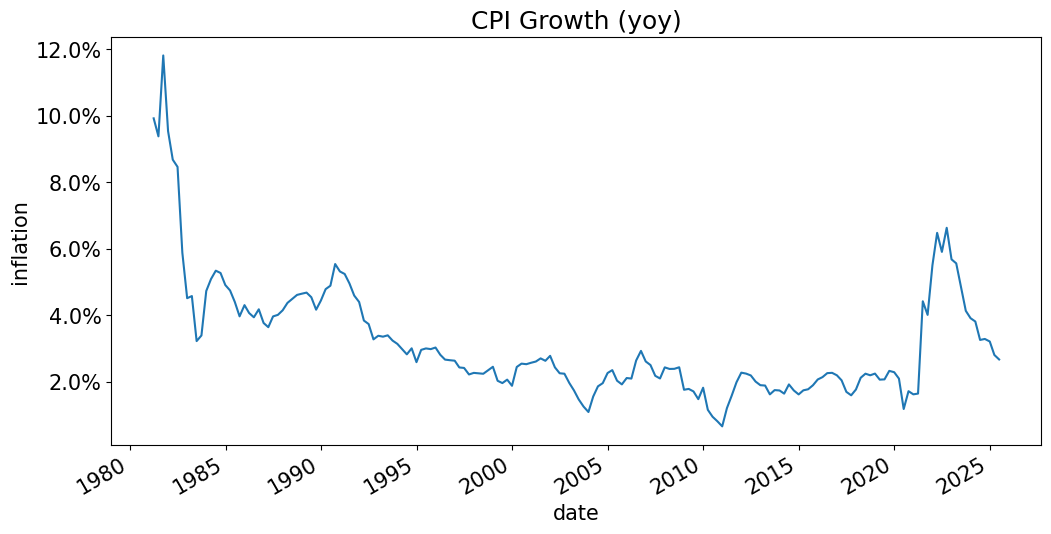
inflation = (data['CPI-Core']/data['CPI-Core'].shift(1) -1 ) * FREQ

inflation_yoy = (data['CPI-Core']/data['CPI-Core'].shift(FREQ) -1 )
ax = inflation_yoy.plot(title='CPI Growth (yoy)',ylabel='inflation')
ax.yaxis.set_major_formatter(StrMethodFormatter('{x:.1%}'))
plt.show()
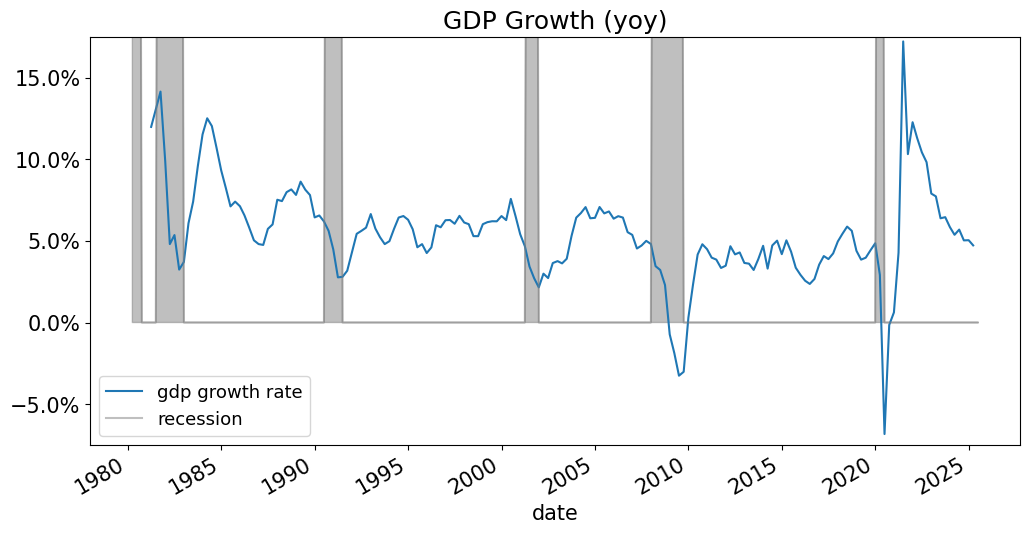
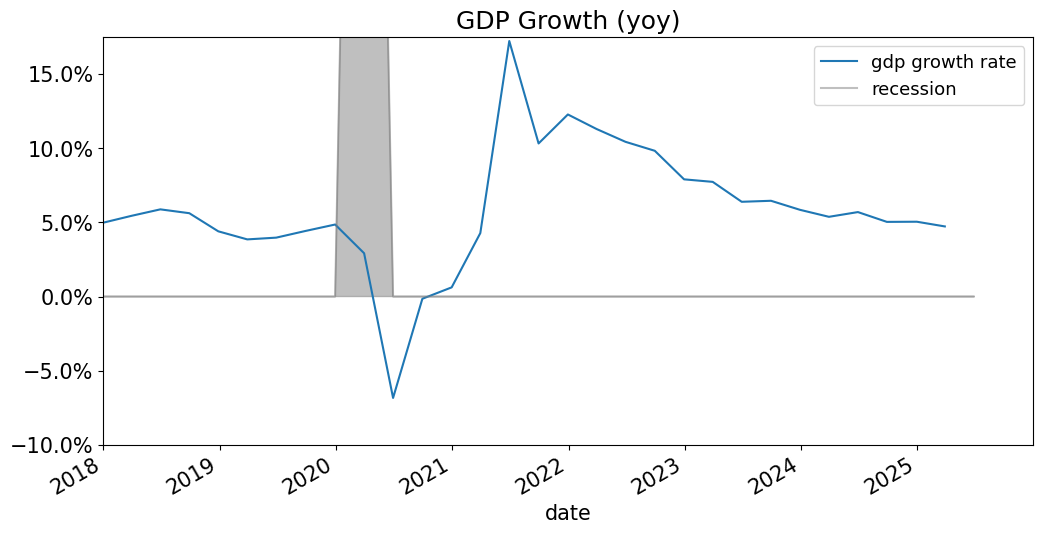
gdp_growth_yoy = (data['GDP'] / data['GDP'].shift(FREQ) - 1)
ax = gdp_growth_yoy.plot()
ax.yaxis.set_major_formatter(StrMethodFormatter('{x:.1%}'))
data['Recession'].plot.area(ax=ax, alpha=0.5,color='gray')

plt.title('GDP Growth (yoy)')
plt.ylim(-.075,.175)
plt.legend(['gdp growth rate','recession'])
plt.show()

ax = gdp_growth_yoy.plot(title='GDP Growth (yoy)',xlim=('2018-01-01','2025-12-31'))
ax.yaxis.set_major_formatter(StrMethodFormatter('{x:.1%}'))
data['Recession'].plot.area(ax=ax, alpha=0.5,color='gray')
plt.ylim(-.10,.175)
plt.legend(['gdp growth rate','recession'])
plt.show()
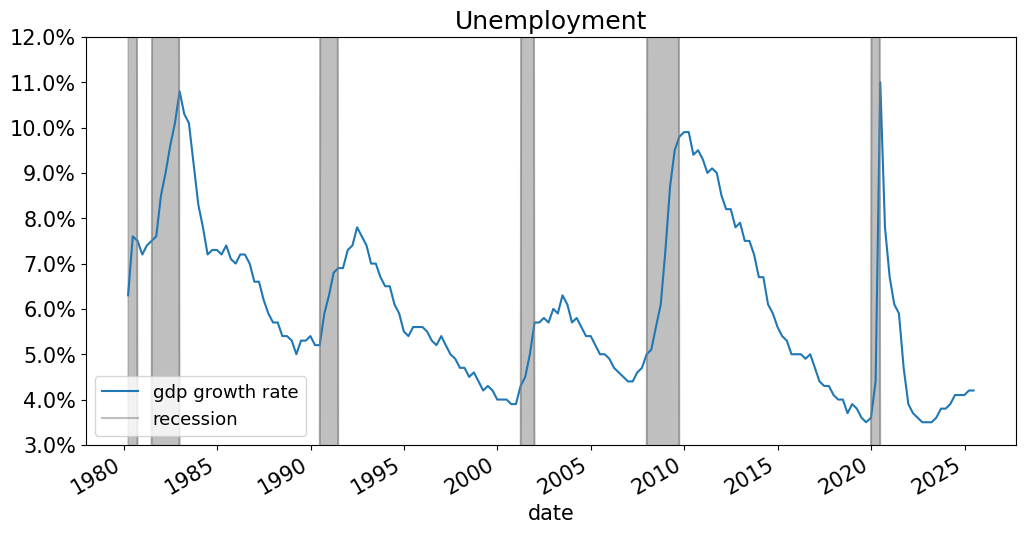
ax = (data['Unemployment']/100).plot()
data['Recession'].plot.area(ax=ax, alpha=0.5,color='gray')
ax.yaxis.set_major_formatter(StrMethodFormatter('{x:.1%}'))
plt.title('Unemployment')
plt.ylim(.03,.12)
plt.legend(['gdp growth rate','recession'])
plt.show()
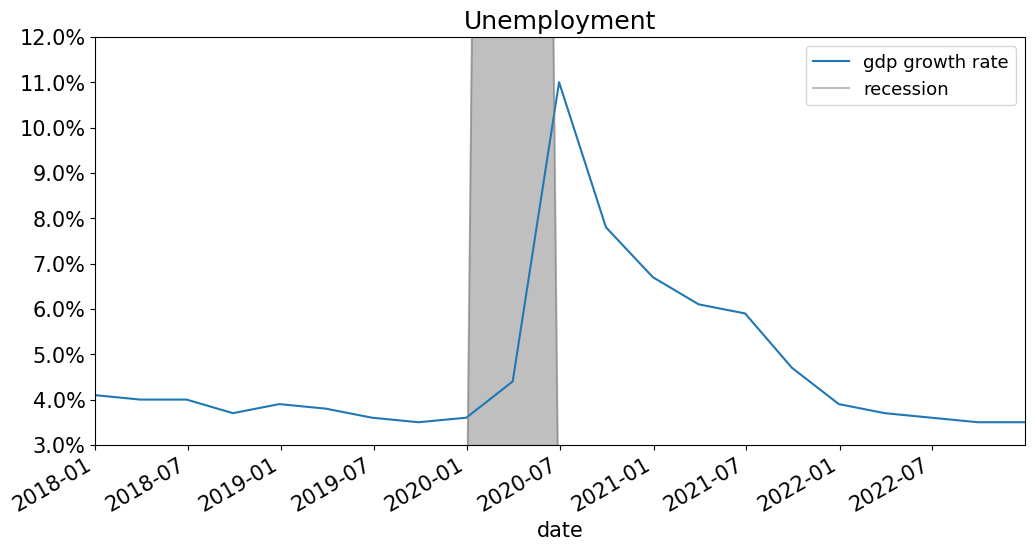
ax = (data['Unemployment']/100).plot()
data['Recession'].plot.area(ax=ax, alpha=0.5,color='gray')
ax.yaxis.set_major_formatter(StrMethodFormatter('{x:.1%}'))
plt.title('Unemployment')
plt.xlim('2018-01-01','2022-12-31')
plt.ylim(.03,.12)
plt.legend(['gdp growth rate','recession'])
plt.show()
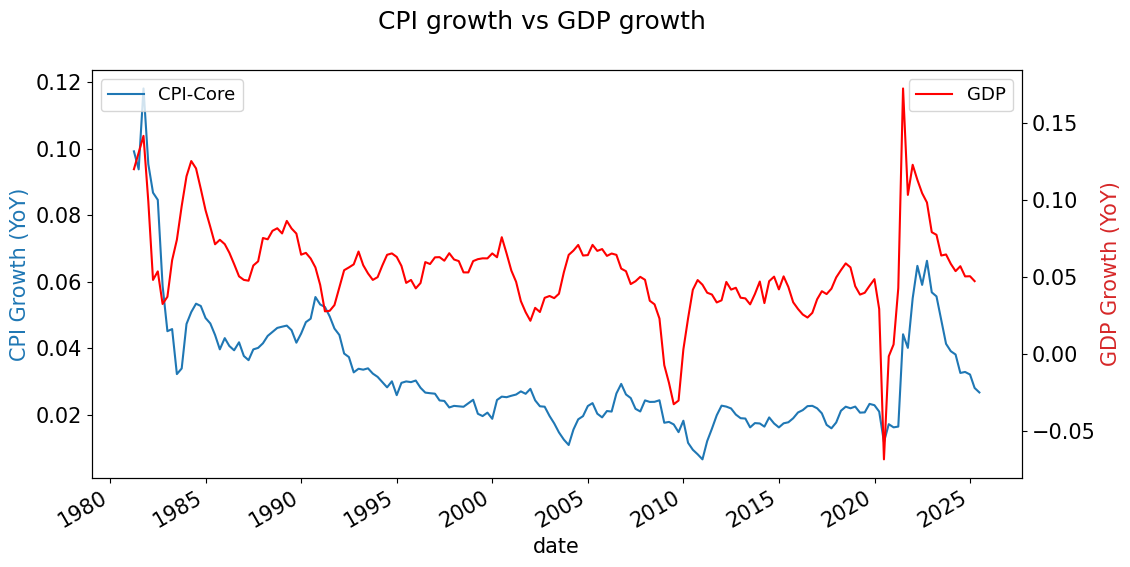
fig,ax = plt.subplots()
inflation_yoy.plot(ax=ax)
ax.legend(loc='upper left')
ax.set_ylabel('CPI Growth (YoY)', color='tab:blue')
ax2 = ax.twinx()
gdp_growth_yoy.plot(ax=ax2,color='red')
ax2.set_ylabel('GDP Growth (YoY)', color='tab:red')
ax2.legend()
fig.suptitle('CPI growth vs GDP growth')
plt.show()
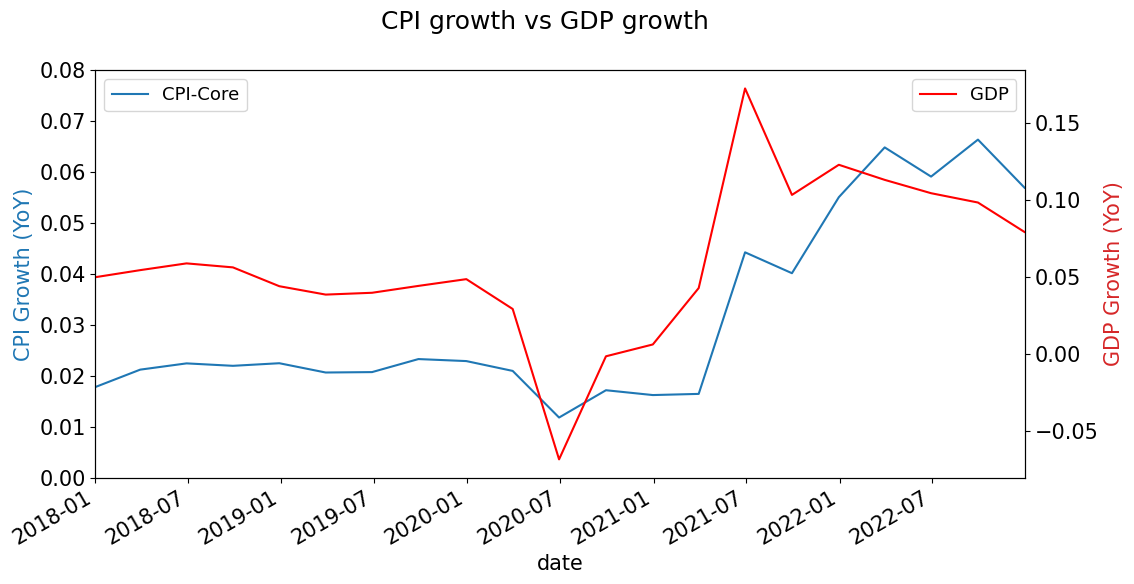
fig,ax = plt.subplots()
inflation_yoy.plot(ax=ax,ylim=(0,.08))
ax.set_ylabel('CPI Growth (YoY)', color='tab:blue')
ax.legend(loc='upper left')
ax2 = ax.twinx()
gdp_growth_yoy.plot(ax=ax2,color='red',xlim=('2018-01-01','2022-12-31'))
ax2.set_ylabel('GDP Growth (YoY)', color='tab:red')
ax2.legend()
fig.suptitle('CPI growth vs GDP growth')
plt.show()
Inflation#
Several theories about the determinants of inflation.
Monetary theory: Money supply (particularly as measured by “M2” money).
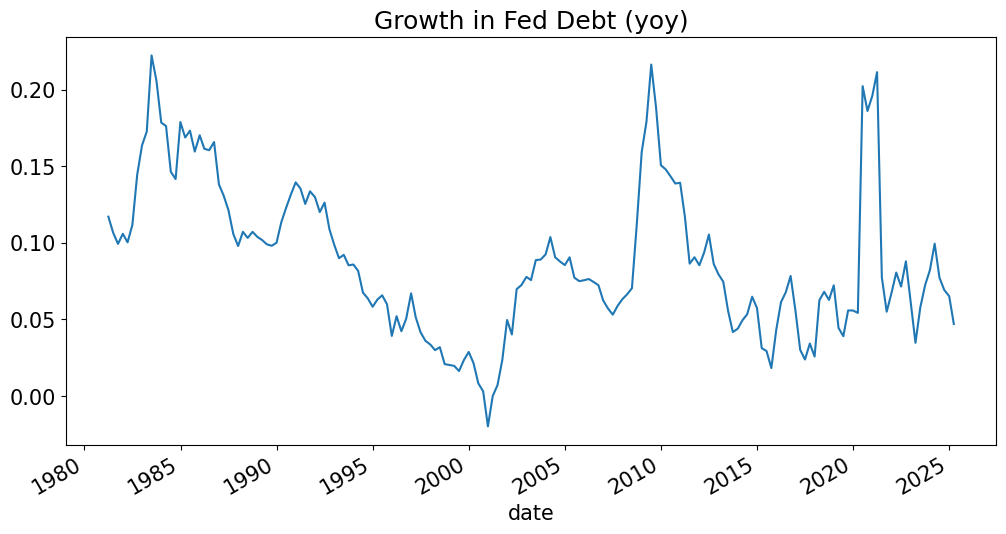
Fiscal theory: Government spending, deficits, debt
Below are a few plots giving context.
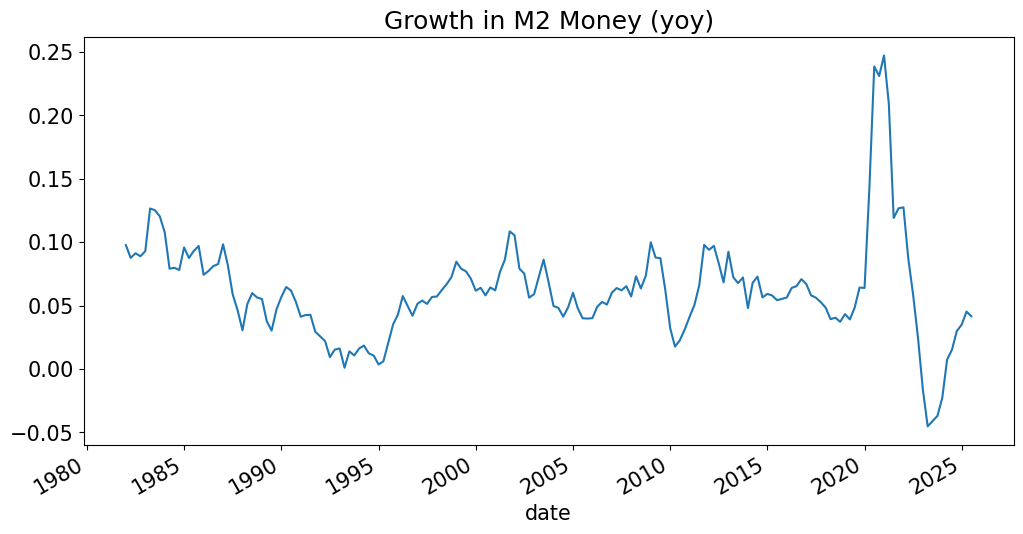
Monetary Theory#
Historically, there is a strong correlation between money growth and inflation (with a lag.)
Milton Friedman famously believed that
Inflation is always and everhwere a monetary phenomenon.
money_growth_yoy = (data['M2 Money']/data['M2 Money'].shift(FREQ)-1)
money_growth_yoy.plot(title='Growth in M2 Money (yoy)')
plt.show()
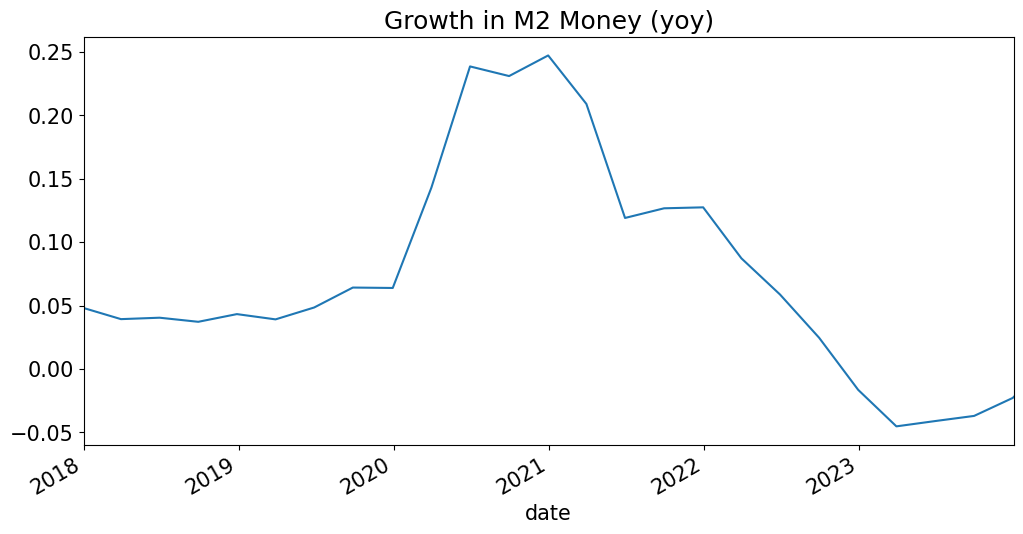
money_growth_yoy.plot(title='Growth in M2 Money (yoy)',xlim=('2018-01-01','2023-12-31'))
plt.show()
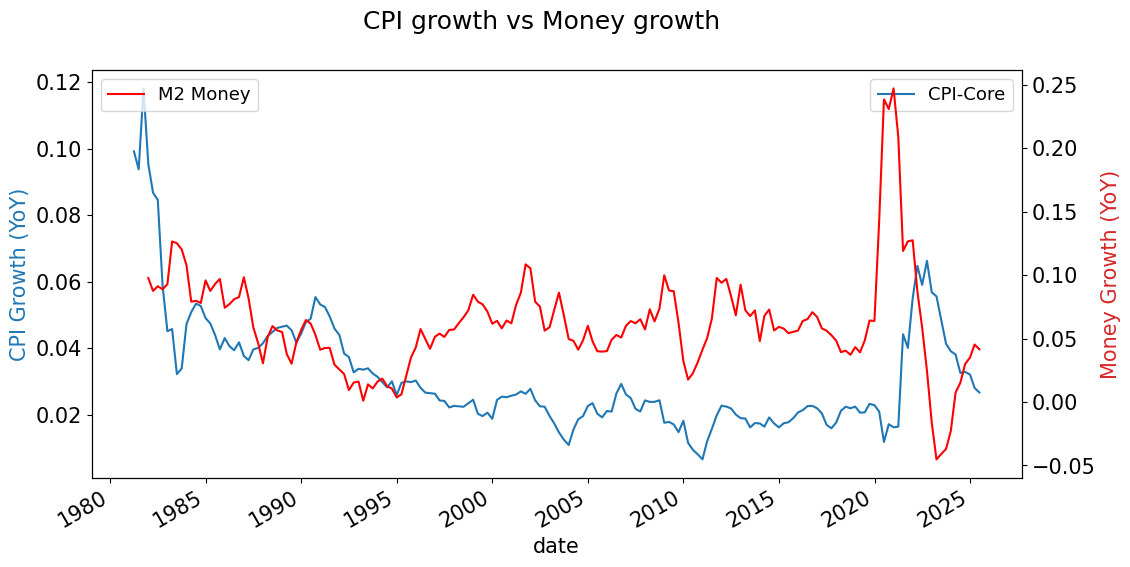
fig,ax = plt.subplots()
inflation_yoy.plot(ax=ax)
ax.set_ylabel('CPI Growth (YoY)', color='tab:blue')
ax.legend()

ax2 = ax.twinx()
money_growth_yoy.plot(ax=ax2,color='red')
ax2.set_ylabel('Money Growth (YoY)', color='tab:red')
ax2.legend()
fig.suptitle('CPI growth vs Money growth')
plt.show()
debt_growth_yoy = (data['Federal Public Debt']/data['Federal Public Debt'].shift(FREQ)-1)
debt_growth_yoy.plot(title='Growth in Fed Debt (yoy)')
plt.show()
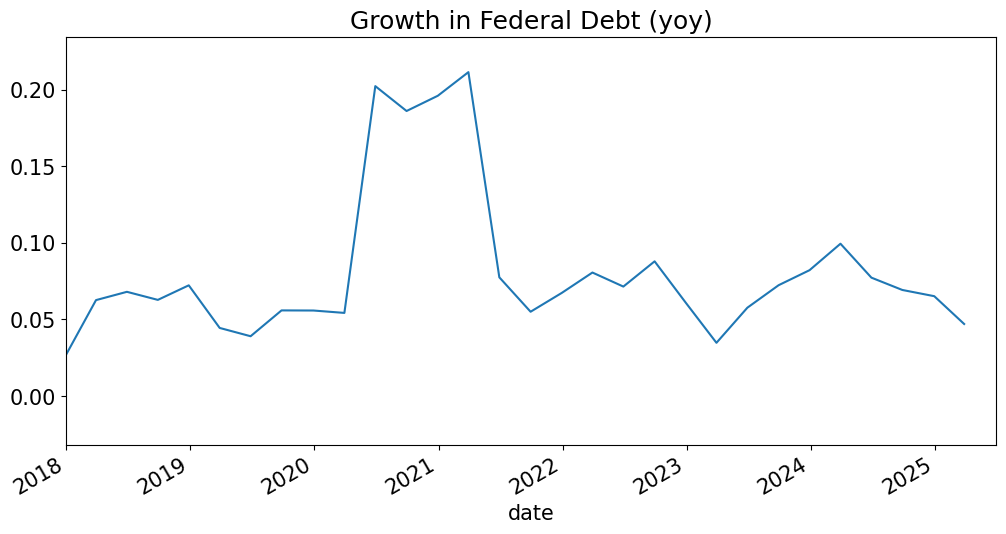
debt_growth_yoy.plot(title='Growth in Federal Debt (yoy)',xlim=('2018-01-01','2025-06-30'))
plt.show()