Treasury Debt#
import warnings
import pandas as pd

import matplotlib.pyplot as plt
%matplotlib inline
plt.rcParams['figure.figsize'] = (12,6)
plt.rcParams['font.size'] = 15
plt.rcParams['legend.fontsize'] = 13

from cmds.treasury_cmds import format_bond_df
Data Source#
CRSP Treasury Monthly Release accessed via WRDS
For any given date, obtain quotes for nearly every issued Treasury.
In particular,
Bills, Notes, Bonds
TIPS
In the analysis below, we exclude TIPS to focus on nominal rates.
The data set does not include Floating Rate Notes (FRNs).
QUOTE_DATE = '2024-04-30'

filepath_rawdata = f'../data/treasury_quotes_{QUOTE_DATE}.xlsx'
data = pd.read_excel(filepath_rawdata,sheet_name='quotes').set_index('KYTREASNO')
tab = format_bond_df(data.head(6))
display(tab)

tab = format_bond_df(data.tail(6))
display(tab)
| type | quote date | issue date | maturity date | ttm | accrual fraction | cpn rate | bid | ask | price | accrued int | dirty price | ytm | total size | |
|---|---|---|---|---|---|---|---|---|---|---|---|---|---|---|
| KYTREASNO | ||||||||||||||
| 208127 | bill | 2024-04-30 | 2023-11-02 | 2024-05-02 | 0.01 | nan | 0.0 | 99.97 | 99.97 | 99.97 | 0.00 | 99.97 | 5.38% | 237569000000.000000 |
| 208162 | bill | 2024-04-30 | 2024-01-09 | 2024-05-07 | 0.02 | nan | 0.0 | 99.89 | 99.90 | 99.90 | 0.00 | 99.90 | 5.55% | 216643000000.000000 |
| 208138 | bill | 2024-04-30 | 2023-11-09 | 2024-05-09 | 0.02 | nan | 0.0 | 99.87 | 99.87 | 99.87 | 0.00 | 99.87 | 5.39% | 228991000000.000000 |
| 208163 | bill | 2024-04-30 | 2024-01-16 | 2024-05-14 | 0.04 | nan | 0.0 | 99.79 | 99.79 | 99.79 | 0.00 | 99.79 | 5.44% | 216622000000.000000 |
| 207714 | note | 2024-04-30 | 2021-05-15 | 2024-05-15 | 0.04 | 0.92 | 0.25 | 99.80 | 99.80 | 99.80 | 0.11 | 99.92 | 5.17% | 88769000000.000000 |
| 206741 | note | 2024-04-30 | 2014-05-15 | 2024-05-15 | 0.04 | 0.92 | 2.5 | 99.88 | 99.91 | 99.89 | 1.15 | 101.04 | 5.08% | 65995000000.000000 |
| type | quote date | issue date | maturity date | ttm | accrual fraction | cpn rate | bid | ask | price | accrued int | dirty price | ytm | total size | |
|---|---|---|---|---|---|---|---|---|---|---|---|---|---|---|
| KYTREASNO | ||||||||||||||
| 208019 | bond | 2024-04-30 | 2023-02-15 | 2053-02-15 | 28.80 | 0.41 | 3.6 | 81.70 | 81.73 | 81.71 | 0.75 | 82.46 | 4.80% | 66347000000.000000 |
| 208062 | bond | 2024-04-30 | 2023-05-15 | 2053-05-15 | 29.04 | 0.92 | 3.6 | 81.73 | 81.74 | 81.73 | 1.66 | 83.40 | 4.80% | 62711000000.000000 |
| 208107 | bond | 2024-04-30 | 2023-08-15 | 2053-08-15 | 29.29 | 0.41 | 4.1 | 89.54 | 89.61 | 89.57 | 0.85 | 90.42 | 4.79% | 71583000000.000000 |
| 208149 | bond | 2024-04-30 | 2023-11-15 | 2053-11-15 | 29.54 | 0.92 | 4.8 | 99.43 | 99.50 | 99.46 | 2.18 | 101.64 | 4.78% | 66444000000.000000 |
| 208191 | TIPS bond | 2024-04-30 | 2024-02-15 | 2054-02-15 | 29.80 | 0.00 | 2.1 | 93.85 | 94.14 | 94.00 | 0.00 | 94.00 | nan% | 9481000000.000000 |
| 208178 | bond | 2024-04-30 | 2024-02-15 | 2054-02-15 | 29.80 | 0.41 | 4.2 | 91.52 | 91.58 | 91.55 | 0.88 | 92.42 | 4.78% | 71199000000.000000 |
Basics of Treasuries#
Timing#
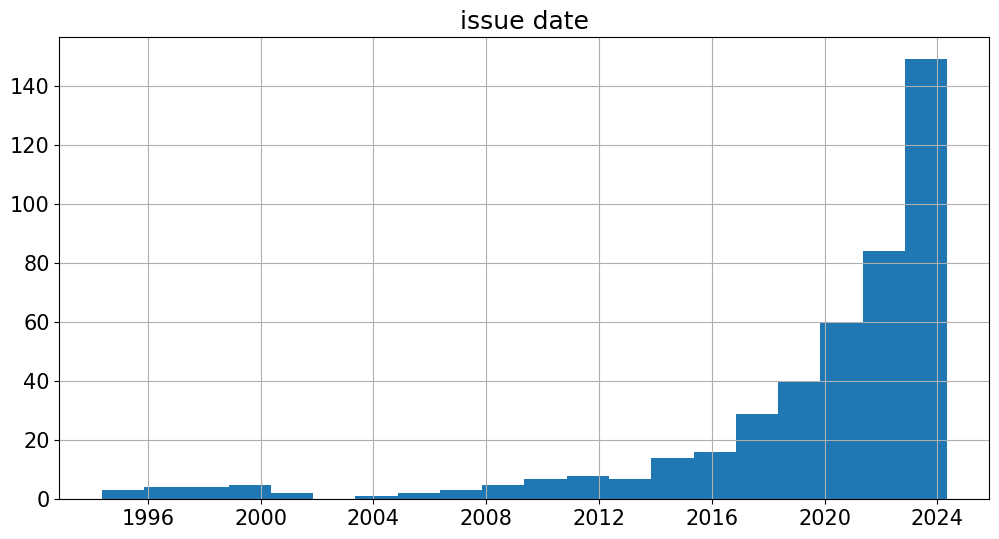
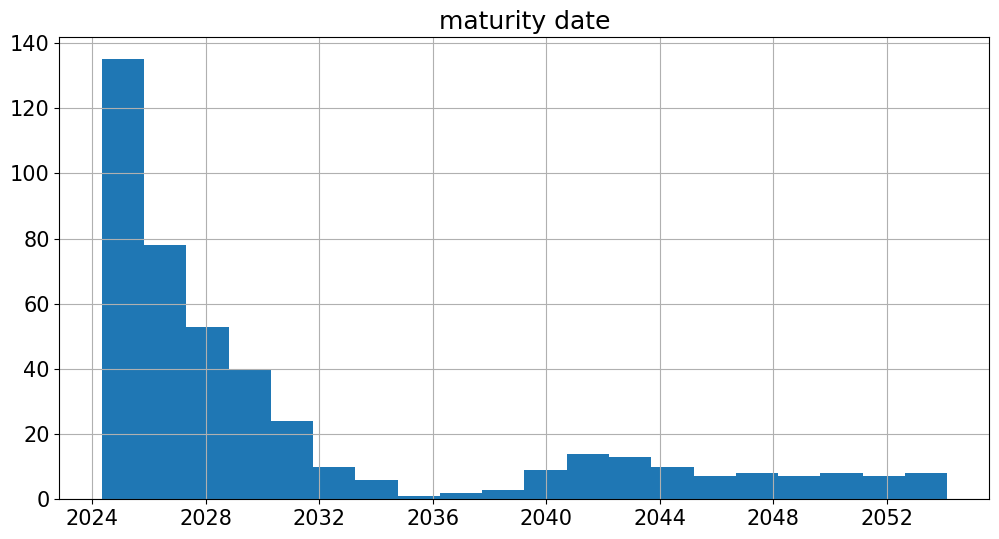
These quotes are at a single point in time.
But they describe bonds covering a wide range of
issuance dates
maturity dates
data.hist('issue date',bins=20)
data.hist('maturity date',bins=20)
plt.show()
Coupon Rates#
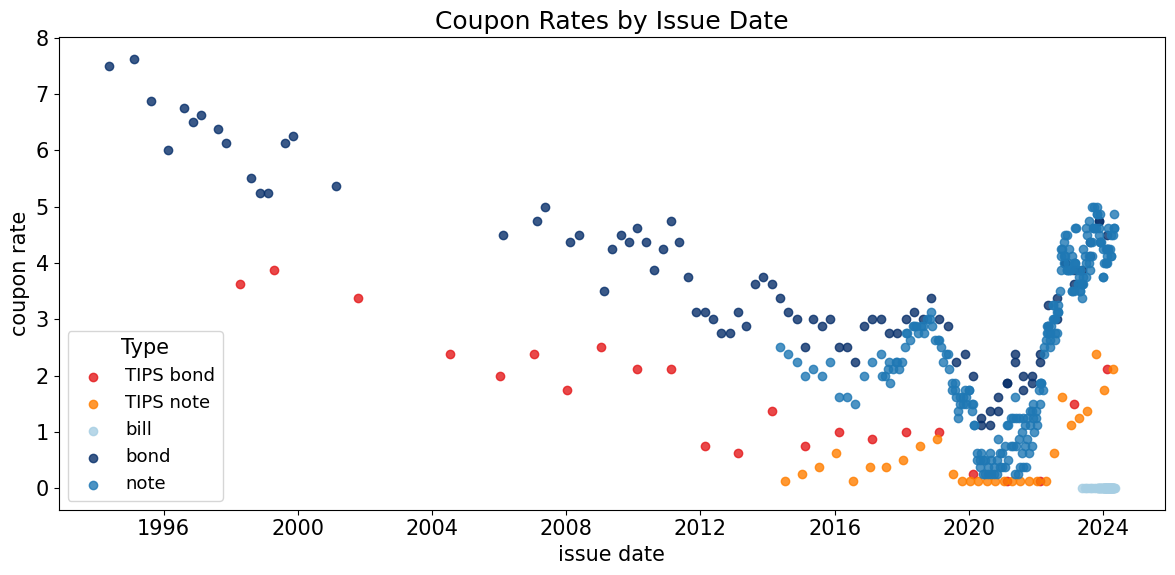
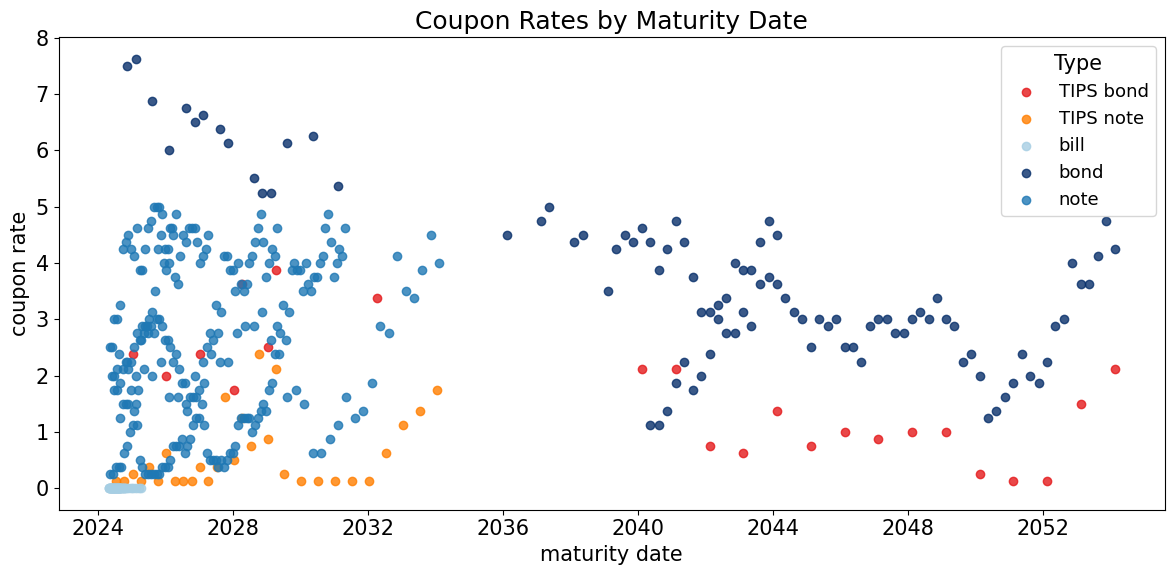
The quoted coupon is the annualized rate (per $100 face value).
It is paid semiannually.
The coupon rate is a feature set by the issuer (Treasury) at the time it is issued.
These rates have varied widely over time.
The Treasury sets coupons near the prevailing interest rate, (i.e., priced near par.)
In the figure below, note that coupon rates have declined over time.
from cmds.plot_utils import scatter_by_type
from cmds.config import COLOR_MAP

ax = scatter_by_type(
    data,
    x='issue date',
    y='cpn rate',
    color_map=COLOR_MAP,
    xlabel='issue date',
    ylabel='coupon rate',
    title='Coupon Rates by Issue Date',
    alpha=0.8,
)

ax = scatter_by_type(
    data,
    x='maturity date',
    y='cpn rate',
    color_map=COLOR_MAP,
    xlabel='maturity date',
    ylabel='coupon rate',
    title='Coupon Rates by Maturity Date',
    alpha=0.8,
)

plt.show()
Issue Types#
Maturity |
Coupon |
Coupon Frequency |
Principal |
|
|---|---|---|---|---|
T-bills |
4, 8, 13, 26, 52 weeks |
None |
None |
Fixed |
T-notes |
2, 5, 7, 10 years |
Fixed |
Semiannual |
Fixed |
T-bonds |
20, 30 years |
Fixed |
Semiannual |
Fixed |
TIPS |
5, 10, 30 years |
Fixed |
Semiannual |
Inflation adjusted |
FRNs |
2 years |
Floating |
Quarterly |
Fixed |
STRIPS |
Derived |
None |
None |
Fixed |
Reference: https://www.treasurydirect.gov/indiv/research/indepth/tbills/res_tbill.htm
Other Instruments#
TIPS#
Treasury Inflation Protected Securities (TIPS)
Treasury notes and bonds (no bills)
Semiannual coupon
Issued since 1997
Inflation protection
TIPS provide a hedge against inflation.
Face value is scaled by CPI
Coupon rate is fixed
Fixed coupon rate multiplies the (CPI-adjusted) face-value, which leads to an inflation-adjusted coupon
Floating Rate Notes (FRN)#
maturity of 2-years
floating coupon
quarterly payment
Discussed in more depth later.
STRIPS#
STRIPS are registered securities created by “stripping” the coupons and principal from an issued Treasury.
This allows investors to trade zero coupon bonds with maturities beyond 1 year.
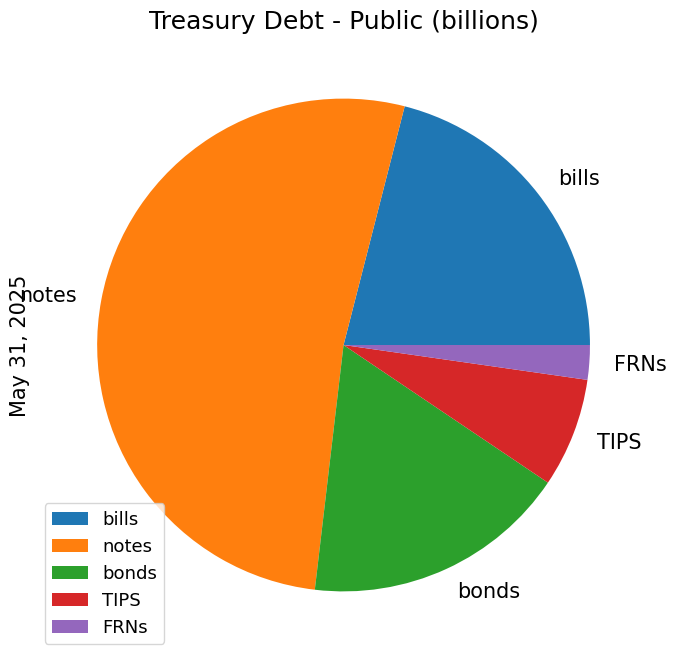
Composition#
debt_outstanding = pd.DataFrame(index=['bills','notes','bonds','TIPS','FRNs'],data=[6002.4,14893.0,4978.5,2049.0,646.3],columns=['public debt (billions)'])
debt_outstanding.plot.pie(y=debt_outstanding.columns[0],figsize=(8,8),title='Treasury Debt - Public (billions)',ylabel='May 31, 2025')
plt.show()
Dealers#
Treasuries are bought by auction or in secondary markets.
Primary dealers buy most new issues at auction and sell them all over the world.
The New York Fed publishes a list of these dealers, along with a “Weekly Release of Primary Dealer Transactions”.
Include Citigroup, Deutsche Bank, Morgan Stanley, Nomura, UBS.
Recent additions or removals?
Pricing#
Price is quoted per $100 face value
Par#
A bond trading above face value is said to trade above par
Bonds with coupons larger than current interest rates will trade above par.#
Trade above par: coupons are large enough to more than offset the present value discount.
Pricing function#
The only features of an issue impacting price would be
remaining maturity: \(T-t\)
coupon rate
In a frictionless market, the
issue date would be irrelevant to the price.
fresh 5-year note and 10-year note issued 5 years ago would have same price if same coupon rate.
But there are frictions and liquidity issues
on-the-run bonds are the fresh (recent) issue and tend to have more liquidity and thus higher price.
Bid-Ask Spread#
The data set quotes a bid and ask.
Bid is the price offered by a potential buyer
Ask is the price offered by a potential seller
For most issues, these are very close.
data['ask-bid'] = data['ask'] - data['bid']
tab = data[['type','issue date', 'maturity date', 'ttm', 'cpn rate', 'ytm', 'price', 'ask-bid']].sort_values('ask-bid')

tab_style = tab.head().style.format({'ytm':"{:.2%}",'price':"{:.2f}",'ask-bid':"{:.4f}",'cpn rate':"{:.2f}",'ttm':"{:.2f}",'maturity date':"{:%Y-%m-%d}",'issue date':"{:%Y-%m-%d}"})
display(tab_style)

tab_style = tab.tail().style.format({'ytm':"{:.2%}",'price':"{:.2f}",'ask-bid':"{:.4f}",'cpn rate':"{:.2f}",'ttm':"{:.2f}",'maturity date':"{:%Y-%m-%d}",'issue date':"{:%Y-%m-%d}"})
display(tab_style)

display(data[['ask-bid']].describe().T.style.format("{:.2f}"))
| type | issue date | maturity date | ttm | cpn rate | ytm | price | ask-bid | |
|---|---|---|---|---|---|---|---|---|
| KYTREASNO | ||||||||
| 208162 | bill | 2024-01-09 | 2024-05-07 | 0.02 | 0.00 | 5.55% | 99.90 | 0.0002 |
| 208127 | bill | 2023-11-02 | 2024-05-02 | 0.01 | 0.00 | 5.38% | 99.97 | 0.0004 |
| 208163 | bill | 2024-01-16 | 2024-05-14 | 0.04 | 0.00 | 5.44% | 99.79 | 0.0004 |
| 208141 | bill | 2023-12-07 | 2024-06-06 | 0.10 | 0.00 | 5.44% | 99.46 | 0.0005 |
| 208164 | bill | 2024-01-23 | 2024-05-21 | 0.06 | 0.00 | 5.41% | 99.69 | 0.0006 |
| type | issue date | maturity date | ttm | cpn rate | ytm | price | ask-bid | |
|---|---|---|---|---|---|---|---|---|
| KYTREASNO | ||||||||
| 207068 | TIPS bond | 2017-02-15 | 2047-02-15 | 22.80 | 0.88 | nan% | 72.55 | 0.2109 |
| 207188 | TIPS bond | 2018-02-15 | 2048-02-15 | 23.79 | 1.00 | nan% | 73.97 | 0.2188 |
| 207327 | TIPS bond | 2019-02-15 | 2049-02-15 | 24.80 | 1.00 | nan% | 73.35 | 0.2227 |
| 208020 | TIPS bond | 2023-02-15 | 2053-02-15 | 28.80 | 1.50 | nan% | 81.10 | 0.2617 |
| 208191 | TIPS bond | 2024-02-15 | 2054-02-15 | 29.80 | 2.12 | nan% | 94.00 | 0.2969 |
| count | mean | std | min | 25% | 50% | 75% | max | |
|---|---|---|---|---|---|---|---|---|
| ask-bid | 443.00 | 0.04 | 0.04 | 0.00 | 0.02 | 0.03 | 0.05 | 0.30 |
On-the-run#
Suppose you are interested in investing in a treasury with 5 years until maturity.
Consider two alternatives:
buy a newly issued 5-year note
buy a 10-year note that was issued 5 years ago
The newly issued note is on-the-run.
A treasury which has aged is off-the-run.
This is an important consideration in liquidity.
financial intermediaries have substantial business in selling the on-the-run while hedging with the off-the-run.
in some sense, this is trading on liquidity.
temp = data[data['ttm'].between(5.9,6.1)].dropna()

earliest_date_index = temp['issue date'].idxmin()
latest_date_index = temp['issue date'].idxmax()
earliest_date_row = temp.loc[earliest_date_index]
latest_date_row = temp.loc[latest_date_index]

tab = pd.DataFrame([earliest_date_row, latest_date_row])

tab[['type','quote date','issue date','maturity date','ttm','cpn rate','price','ytm','total size']].style.format(
    {'ytm':'{:.3%}',
    'issue date': '{:%Y-%m-%d}',
    'quote date': '{:%Y-%m-%d}',
    'maturity date': '{:%Y-%m-%d}',
    'price':'{:.2f}',
    'cpn rate':'{:.2f}',
    'ttm':'{:.2f}',
    'ask-bid':'{:.2f}',
    'total size':'{:.1e}'
    })
| type | quote date | issue date | maturity date | ttm | cpn rate | price | ytm | total size | |
|---|---|---|---|---|---|---|---|---|---|
| 204096 | bond | 2024-04-30 | 1999-11-15 | 2030-05-15 | 6.04 | 6.25 | 107.90 | 4.732% | 1.7e+10 |
| 208059 | note | 2024-04-30 | 2023-05-31 | 2030-05-31 | 6.08 | 3.75 | 94.89 | 4.726% | 4.2e+10 |
Quoting Conventions#
Bonds differ in maturity and coupons, so looking at their relative prices is an apple-to-oranges comparison.
Yields are a form of price quote that accounts for the maturity and coupon.
YTM#
The YTM discussed above is the most important yield.
It is used in quoting and analyzing bonds.
The YTM is not necessarily a sufficient statistics for all dimensions of a bond–price, coupon, maturity. Thus, two with equivalent YTM may have important differences.
Discount yield#
The discount yield is important for quoting money-market prices.
it is not popular for analyzing and research
it is perhaps vestigial to a time when traders needed to calculate by hand and calculator
Treasury bills are typically quoted as discount yields.
Consider
price of \(P\)
face value of 100
no coupon
Then, $\(\text{discount yield} = \left(\frac{360}{n}\right)\frac{100-P}{100}\)$
Example#
A T-bill maturing in 90 days with cash price of \(P=99\) will have discount yield of $\(Y_{\text{discount}} = 4\%\)$
Note that it will be common to go the other way around: read quotes for 90-day T-bills of 4% (or simply, “4”) and understand that as an actual price of 99.


Reference: Bloomberg B Govt
Price Quotes#
T-notes and T-bonds are quoted in thirty-seconds (1/32) of a dollar rather than hundredths of a dollar.


Reference: Bloomberg T Govt
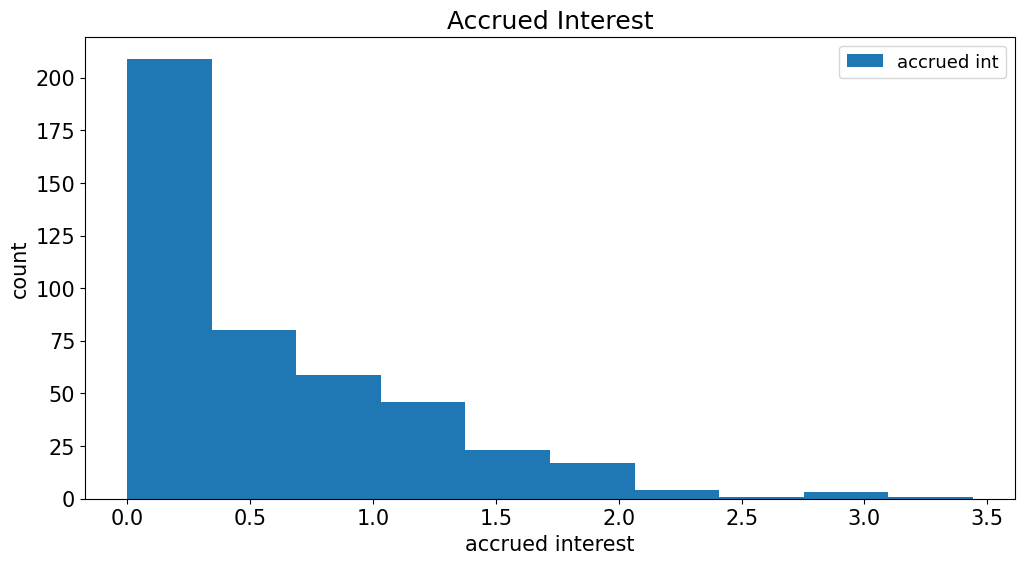
Accrued Interest#
Accrued interest is proportional to the coupon rate, based on the number of days since the last coupon (or, until the next coupon.)
data[['accrued int']].plot.hist(title='Accrued Interest',xlabel='accrued interest',ylabel='count');
Day-Count Conventions#
The accrued interest is computed with a day-count convention
Common day-count conventions include:
actual/actual: treasury notes and bonds
30/360: corporate and municipal bonds
actual/360: money-market instruments (issued with 1yr or less, little credit risk)
Careful, or can lead to seeming arbitrage that doesn’t exist.
We will not focus on the taxonomy of day-count conventions in discussions below.
important to know what it is
look it up when necessary
Market Sizes#
Size of Treasury Debt Markets#
https://fred.stlouisfed.org/series/GFDEBTN
Composition of Treasury Debt#
Monthly Statement of the Public Debt
STRIPS
Size of Fixed Income Markets#
https://www.sifma.org/resources/research/us-fixed-income-securities-statistics/